
Abstract- Actually, geology has become a fundamental tool to determine areas of susceptibility, vulnerability and geological risk. The geological dynamics and the accelerated changes of the processes at the climatic level in the last decades have demonstrated the close relationship between geological space and sustainable urban development of a city. From this interaction, it is possible to respond to the growing demand for environmental and urban solutions. At the national, regional and local level where the study area is located, there is a growing need to create new urban areas, but these are not linked to an adequate analysis of the geological environment and knowledge of the main factors that control susceptibility vulnerability and risk conditions and consequently, their impacts.The methodology to achieve the objectives was based on a characterization of the geological, hydrogeological and geomechanical conditions of one of the main urban irregular urban settlements of the city of La Paz, capital of the State of Baja California Sur., Mexico, using the methodology. of the Analytical Hierarchy Process (AHP), in combination with the multi-criteria analysis (MCA), thus obtaining a risk susceptibility map and a set of thematic maps related in local areas to flood events, debris flows, landslides rocks and landslides. The results represent the first stage of a larger project and with this it is possible to contribute new knowledge to be used in the more precise zoning of geo-hazards, which will allow the State capital a sustainable growth of the population of the city., the improvement of current construction standards and the corresponding zoning to anticipate their development in an orderly manner.
Keywords- Geological risks; sustainable urban development; zoning; Analytic Hierarchy Process (AHP)., Multi-Criteria Analysis (MCA).
I. INTRODUCTION.
Climate change and increasingly extreme meteorological phenomena have caused an increase in natural disasters in the last 50 years, disproportionately impacting the poorest countries, according to the World Meteorological Organization (WMO) and the Office. of the United Nations for Disaster Risk Reduction (UNDRR). More than 11,000 disasters attributed to these hazards were recorded worldwide, with just over two million deaths and $ 3.64 trillion in losses. More than 91% of deaths occurred in developing countries. In Latin America, these earth movements are constant and cause landslides and rocks as a secondary effect. The geographical location of Mexico causes the country to face various geological risks caused by the constant plate tectonic movement and local heat concentrations. In addition, factors such as the exploitation of resources natural resources, including the extraction of water and hydrocarbons subsoil, can increase the probability of occurrence of a natural geological disaster.
According to the Mexican Geological Service (MGS), there are three groups of geological hazards: the first encompasses the phenomena caused directly by the dynamics of the processes geological (volcanoes, earthquakes and tsunamis); the second comprises those derived directly from the dynamics of the external geological processes (floods and movements gravitational), and finally there are those that are induced by the direct intervention of the human being in the environmentgeological or its dynamicsEnvironmental interactions between factors such as climate, topography, geology and the mechanical resistance of the rock (Geological Resistance Index-GRI) (Hoek et al., 1994) play a very important role as trigger mechanisms of the removal processes to increase knowledge of this type of process, it is necessary to consider these relationships in removal processes.
Therefore, in recent years, landslide hazard and risk assessment has become an important topic of interest for geoscientists, engineers and also for the community and local administration in many parts of the world. Considerable research work involving landslide risk assessment and impacts has been conducted where a large number of researchers have used remote sensing and GIS techniques to demarcate landslide hazard or susceptible areas (Gupta and Joshi, 1990; Dai et al., 2001; Cevik and Topal, 2003; Tangestani, 2004; Ayalew and Yamagishi, 2005; Akgun and Bulut, 2007).
It is considered that the geological characteristics of the Southern Region of the Baja California Peninsula where the city of La Paz is located have been described in various research works by various authors and institutions at the regional and local geology level (Mina, 1957), (Ortega-Gutiérrez, 1982), (Aranda-Gómez and Pérez-Venzor, 1988a, 1989b) (Schaff et. al, 2000), and more recently the work carried out by Pérez-Venzor, 2013 makes a geological-geochemical study of the southern portion of the State (Los Cabos Block) where this study area is referred to as part of a Plutonic Geological Complex in the Province of La Paz.
Within Baja California Sur, urban geology has focused on isolated works that consist of the identification of geological risk zones in the southern portion, in the Cabo San Lucas area (Rojas-Álvarez, 2007) and recently in 2012 the atlas of natural hazards was prepared at the state level.
Therefore, it is observed that a more specific geological recognition is required, that is, at a scale (Urban settlement) where possible geological risks and risks derived from hydrometeorological events are characterized and identified.One of the most important measures for the prevention and reduction of losses due to mass movements refers to the zoning of the susceptibility and threats of the territory.
Therefore, a systematic mapping of the most susceptible areas is needed, these being defined as the zones or areas with the highest susceptibility, usually expressed in cartographic form that are generated with the support of geographic information systems (GIS), satellite images and work. geological field. Recently, this methodology has been applied in areas of local scale (urban settlement) in the capital city of La Paz with the characterization of the susceptibility of geo-hazards in different urban areas (Hirales-Rochin, and Cazares-Urcadiz, 2018, Hirales-Rochin, 2019, Hirales-Rochin, 2020). The objective of this study was to zonify the geo-hazards associated with urban geology based on areas susceptible to landslides, fallen rocks and flood-prone areas, in the Vista Hermosa urban settlement using RS and GIS techniques.
II. MATERIALS AND METHODS
1.Study zone
The city of La Paz is characterized by a morphology dominated by basins and mountain ranges, the result of the interaction of magmatic-tectonic processes, which is settled in Holocene deposits that correspond to alluvial material (varying from sand to sandy gravel) of active streams., where the thickness of the material varies and can reach a few meters in the main streams (INEGI, 1995). Geologically in the area volcanic and volcanoclastic rocks outcrop (sandstones and volcanoclastic conglomerates, rhyolitic tuffs, andesitic lahars and lava flows) are represented by the Comondú Formation with an age between 30 and 12 Ma in the central portion (Aranda-Gómez and Pérez- Venzor, 1988, 1989a and b Ortega-Gutiérrez et al. 1992; Pérez-Venzor, 2013).
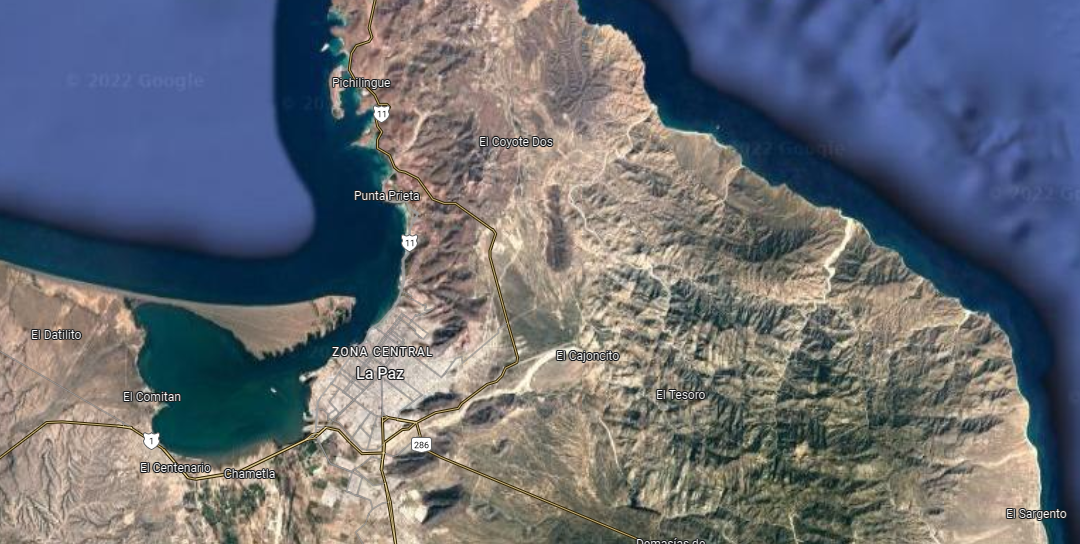
The total population of the city of La Paz is 251,871 inhabitants, of which 126,397 are men and 125,474 are women. The area of study within this capital of the State is the VistaHermosa urban settlement, which is located in the northwestern portion of the city of La Paz, with a latitude of 57300-57350N and a longitude of 2671000-2672000 W (Figure 1). It also has an area of 32,000 m2

Figure 1. Elevation map where the study area is located towards the NE portion of the city of La Paz, BCS., Mexico.

Figure 2 Geologic map of study area located in the northwestern portion of the city of La Paz., Mexico.
2-Lithology
The lithology is represented in a volcanic and vulcanosedimentary sequence, distributed in isolated outcrops within thearea (Figure 2). Therefore, it is necessary to mention that there are no outcrops with stratigraphic continuity, or rock body,which can serve as an index horizon that suggests the position that a given unit occupies in the sequence, except for the”Rhyodacite Providencia” (Hausback, 1983). For example, the movement of lava or pyroclastic spills controlled by thecontemporary drainage pattern to volcanism, combined with erosion effects.
3–Structural geology
In the regional area that includes the VistaHermosa urban settlement, it is possible to distinguish a series of alignmentsand irregularities in the drainage pattern and slope of the relief in the NS direction that is controlled by normal componentfaults, which have a scale of about 10 m. long with a dominant heading NE/NW or fractures in the form of diaclases thatform patterns (Figure 2).

Figure 3 Panoramic view of VistaHermosa urban settlement 1) Irregular urban development in risk areas 2) Fallrocks in the outer portion of the urban settlement 3) Structural feature in the lithology that shows a normal fault. It is considered that in this region there may be a normal inclined fault towards which the base of the riodacitic spillemerges at heights greater than 200 m, near of the urban settlement, but that it is difficult to give continuity since there aremany deposits of debris that cover the lower parts of the topography.
In an annexed way, families of structural data were analyzed where it was possible to distinguish a series of alignmentsand irregularities in the drainage pattern, a series of fractures with a normal component that cuts the upper-middle part of thelithological sequence was recognized. Which have a scale of about 2-15 m. of length with the dominant course as fractures (Figure 3) in the form of diaclases in a system of three main orientations. Considering this, they weregrouped into three data sets (Fractures 1: NE /SW, Fractures 2: NW/SE, Fractures 3: N/S) and they were represented onstereographic diagrams to select the areas of greatest susceptibility .

Figure 4 Stereographic projection of the structural geology (fractures and faults).
The contour projection shows the concentration of structural data and the trend of the structural behavior of faults and fractures within the compression axes (P), within the NW/SE quadrants. The structures formed by tension axes (T) are concentrated in the NE/SW quadrants.
5.-Geological and geohydrological risks.
The urban settlement due to its physical characteristics is influenced by some phenomena with potential for affectation,which are described below- Floods Due to its climate, topography, type of soils and slopes, the Valley and city of La Paz characterizes its surface hydrologydue to the lack of rivers or permanent surface flows. However, the extent of the basin is defined by intermittent streamsoriginating in the Las Cruces range and the plain in which these runoffs are distributed until they flow into the Bay of LaPaz, which are reactivated during the season of rainfall and hurricanes, constituting those important areas of flooding aregenerated in the area peripheral of the city of La Paz.The hydrological response of an area depends on its physiographic and geohydrological characteristics and urban development, where it can be generated: slow or fast floods. This means that, where the hydrological response is slow, floods are generated in a relatively long time (on the order of several hours or days) and the material damage is high. Whereas when the flood forms in a short time (from a few minutes to a couple of hours) it is called a flash flood, mainly causing the loss of human life in populated areas (Hirales-Rochin, 2021).
The VistaHermosa urban settlement is located in the northwestern portion of the La Paz basin, Baja California Sur., Mexico and it´s characterizedby a stream that is crossed by the mainstream of about 15m. wide and with irregular margins, that reach about 3m high. In the elevated areas of study area surface streams are formed in periods of rainfall and hurricanes with flood risk areas in irregular urban areas (Figure 4).

Figure 5.-A) Panoramic view of la VistaHermosa urban settlement, B)-C) Slope behavior and irregular urban development D)Lithology outcrop in the elevated zones E) Urban development in risk zones and surface runoff.
This aspect is significant in this town due to the proximity of the urban settlements to the creek, which varies from 20mto 80m apart, and without any civil protection work, that protects the new urban conditions of the urban settlement. Due to these characteristics, the importance of precipitation, geology, and its relation to meteorologicalevents are pointed out. These three factors affect the sediment transport process.It is observed that there are slope areas in the surrounding relief with surface runoff areas that cross some roads, which indicates the potential for sediment transport and deposition that occurs in this urban settlement (Figure 4).
6.Landslide-concepts
Slope processes are also called gravitational processes, mass movement, or removal processes, in a general sense, alsoknown as landslides. The most accepted and applied classification of the processes of mass recognition at the internationallevel is based on the movement mechanism, which is why, in general, these movements are divided into falls or falls(falls), overturns or collapses (collapses), landslides, lateral expansions (lateral diffusion), flows and complex movements. The European Programme on Climatology offers a simple and complete classification that considers these aspectsand Natural Hazards (EPOCH,1993), which, based on the classification by Varnes (1978) and Hutchinson (1988), drawsa distinction between the type of movement and the materials involved. According to this classification, the differentmovements (landslides, overturns or collapses, landslides, lateral expansions, flows, and complex movements) aresubdivided according to the formation materials, which can be rocks, rubble or rubble, and soil.
Removal processes in earthworks occur due to two fundamental causes, which are external and internal (Terzaghi, 1950;Selby, 1993). External causes are all those that cause an increase in stress or stresses, but not in the resistance of thematerials, while internal causes are those that decrease the resistance of the materials without changing the stress orstresses.
The most accepted and applied classification of mass removal processes at the international level is based on themechanism of the movement, so in general, these movements are divided into falls or falls (falls), overturns or collapses(topples), slides, lateral spreading, flows, and complex movements. A simple and complete classification that considers these aspects is that offered by the EPOCH program (1993), which,based on the classification by Varnes (1978) and Hutchinson (1988), elaborates a distinction between the type ofmovement and the materials involved (Figure 5). According to this classification, the different movements (landslides,overturns or collapses, landslides, lateral expansions, flows, and complex movements) are subdivided according to theforming materials, which can be rocks, debris or debris and soils (Alcantara-Ayala,2000) In this context the most widelyaccepted classification by Cruden and Varnes from 1996 is suggested to be used (Figure 5).
6.1.-Types of movements
6.1.1 Falls
The landslides or falls are the movements in the free fall of different materials such as rocks, debris, or soil.This type of movement originates from the detachment of the material from an inclined surface, which can bounce, roll, slide, or flow downstream. The material considered does not include small particles, the result of weathering. These movements are defined based on the material involved, which is why they are generally classified as rockfalls, debris falls, and soil falls. The speed of these movements can be fast or extremely fast, except when the displaced mass undergoes undermining or incision, and the detachment or fall is preceded by slides or overturns that separate the displaced material from the intact mass (Cruden and Varnes, 1996). These movements occur on steep slopes; both natural and artificial (Figure 5).
6.1.2 Slides
Slides are downslope movements of a mass of soil, debris, or rock, which occurs on a recognizable brittle surface. Frequently, the formation of transverse cracks is the first sign of the occurrence of this type of movement, which is located in the area occupied by the main scarp. The rupture surface defines the type of slip, whereby curved, concave, or spoon-shaped surfaces are associated with rotational slides, semi-flat or wavy rupture surfaces with translational movements, and flat surfaces with flat glides. In rotational landslides, the blocks located at the top lean back, the main scarp is regularly vertical, the displaced mass accumulates down the slope and its internal deformation is of a very low degree. Later movements to the initial one, can cause the progressive backward movement of the crown. The speed and length of this type of movement are highly variable.
Translational landslides are shallower than rotational landslides, and like planes, involve movement parallel to the surface, which is largely controlled by weak surfaces of the forming materials. Based on the stages of the movement, the rotational landslides are classified as simple, multiple and successive, aclassification that also applies to the resulting variants of the type of material (example: a rotational landslide of rock, debris, soil; and therefore, single, multiple, successive rock slide, etc.). Translational landslides are subdivided into blockslide landslides, block slide landslides, and translational landslides (slab slide). Flat landslides are classified in simpleterms based also on the material involved, which is why the main types are rock slides, debris slide, and mudslides.
6.1.3 Flows
The flows (Figure 5) are spatially continuous movements, in which the shear surfaces are very close, of short duration, and, therefore, difficult to observe. The movement of the flows is very similar to that of a viscous fluid, reason for whichthe velocity distribution is not homogeneous and originates the formation of lobes from the predominance of intergranularmovement. Flows involve all types of materials available and are classified based on their content, therefore they aredivided into rock flows, debris flows, and soil or sand flows.

Figure 6 Landslide classification after Cruden and Varnes, 1996 (Taken from the web page of British Geological Survey).
6.1.4 Topless
A topless (Figure 5) consists of the rotation of a ground, rubble, or rocks around an axis or pivot determined by its centerof gravity. Its movement is forward or outward, so it implies inclination. They frequently occur on one or more surfaces, in materials that have a preferential system of discontinuities such as joints, tension cracks, or columnar surfaces that areclassified as overturning or spillage of rocks, debris, and soils. These movements (Figure …) are the result of the fracturing and expansion of compact rock soils or levels, due toliquefaction or fluidization of the underlying material, occur when thick materials, such as rock fragments, gravel. are embedded in a finer material matrix or contain clays. The shear surface is not well defined, the mass involved movesfast and its transfer can take several minutes. This type of movement occurs mainly in a shallow lake and lakeenvironments, which are located at the source of ancient ice caps on the coasts of Norway, Alaska, and Canada.
6.1.5 Flows
Can be triggered by rotational movements or by seismic effects. They are classified into lateral expansions in rocks (rockspreading), in debris (debris spread), and in soils (soil spreading).
6.2. Complex movements
Complex movements occur when the initial type of movement is transformed into another as it moves down the slope, among the most important of which are avalanches or avalanches of rocks and sliding flows. Avalanches or avalanchesof rocks consist of the mobilization at great distances of large masses of rocks and debris, which travel at high speed. Sliding flows are the result of the sudden and large-scale collapse of a mass of granular material or debris traveling at fastor extremely fast speeds, as a result of a disturbing effect. The material involved is metastable, with a loose structure andhigh porosity. During the collapse, the ground load is transferred to the pore fluids (generally water), which causes anincrease in the pressure of the latter and, therefore, the loss of resistance, causing the sliding flow (Hutchinson, 1988). Ingeneral, the resulting morphology is long and narrow, and the deposit area is relatively low in thickness.
6.2.1 Fundamental causes of movement
Mass removal processes or ground movements occur due to two fundamental causes, which are external and internal(Terzaghi, 1950; Selby, 1993). External causes are all those that cause an increase in tension or stresses, but not in theresistance of the materials, while internal causes are those that decrease the resistance of the materials without changingthe tension or stresses. In this way, it can be said that mass removal processes are those movements of soil, debris, androck masses that occur on a slope as a result of the direct influence of gravity, and that can be triggered by internal orexternal factors or in simpler terms, that these processes occur when a portion of the slope becomes too weak to supportits weight.
Among the most important external changes are the geometric or weight changes suffered by the slopes (as a result oferosion, undermining, incision of a river, artificial excavations, loads and discharges), the natural and artificial transientstresses at which They are exposed (earthquakes, vibrations due to explosions or the use of heavy machinery) and thechanges in the hydrological regime (intensity and duration of rainfall, etc.). The main changes of internal type are relatedto the transformation of materials through.
III. METHODOLOGY
The present study represents the first stage of a larger-scale project, comprising several stages divided into different areas of the city of La Paz, in order to understand the comprehensive geological-urban knowledge. The methodology applied for the first time was based on the heuristic (Figure 6).

Figure 7 -Methodology applied to the study area. The Analytic Hierarchy Process (AHP) development by Saaty (1980) [26], which consists of matrix analysis and involves value judgments.
In this way the matrix of preference over the selected criteria was generated, obtaining the weighting of the eight chosen variables. It was important the knowledge of the study area, the documentation and local studies generated to date, where the criteria of the specialists are taken up.
6.3 Estimation and numerical assignment of slip factors.
The determination of the numerical assignment of the landslide risk assessment factor is a numerical system that depends on the relevant factors. By superimposing the elements or parameters indicating threats and / or risks, a zoning map of landslide susceptibility can be drawn up, delimiting the risk areas, giving each factor a specific weight and value, and analyzing the situations site by site, with the help of the various thematic maps [27]. For this reason, factors specific to the physical environment were identified for the study area and numerical values were assigned to the factors based on the degree of influence on the instability of the slope. The different classes within each causative factor were also assigned values according to their influence in causing instability, in order to give a more precise assignment of each causative factor and its respective subclasses.The relevant factors for the zoning mapping of susceptibility to landslide risks include: lithology, slope, elevation, use and land cover, density of urban roads, lineament density, drainage density and precipitation (rainfall). The stability of an area is multifactorial and the behavior of each factor has different degrees of influence, so the maximum numerical estimate of the slip hazard evolution factor for different categories is determined on the basis of its estimated importance to cause instability. The important factors responsible for the area of landslides were assigned numerical values (range) on a scale of 1 to 5 in order of importance. The rating was assigned to the classes of the factors in ordinal scales from 1 to 5 (Table 1), where a higher rating indicates a greater susceptibility to the occurrence of landslides.

Table 1.-Table of values assigned to the conditioning factors for areas susceptible to geo-hazards
This part of the methodology is the basis for giving weight (wi) to each parameter and defining its relative importance to induce landslides (Ri). These weighted factor maps were superimposed using a multivariate criteria analysis to prepare a risk susceptibility map (MSR) for the present study area (Figure 7) [28].
6.2.-Data used
In this study, various types of remote sensing data were used to detect characteristics of landslides, for example, remote sensing products stereo-which in turn reveal the actual morphodynamic characteristics of the areas susceptible to removal and fallen rocks for EOS (Earth Observing System) data and Landsat 7-8 (2014-2018): In addition, published reports, field studies, interpretation of digital aerial photographs (FAD) (50,000 scale 10,000-1) were used. This data set was compared with the landslide characteristics generated from aerial photographs and satellite images (WorldView-4) (November / 2016), which are also generated in the UTM reference system. They were conducted multiple field research and ground control points (PCT) using the global positioning system (GPS) for collecting map information about locations of areas susceptibility of landslide (rockfall, removal rocks & debris flow).
6.3. Mapping risk vulnerability
The risk vulnerability map is based on a zoning of landslide risk (rock removal, debrisflow and falling), which was prepared when calculating the landslide potential index and classifying the slip potential index in several lands susceptible to landslide, as low, medium, high and very high. The slip potential index is defined as:
Slip potential index (SPI)
(SPI) = Σn i = 1 (wi * Ri) (1)
Where wi denotes the weight for the factor i and Ri denotes the classification of the class of the factor i. In this study, the total number of factors (n) is 8, where the class classification varies from 1 to 5.
The landslide model was created and the weighting and classification are assigned to each category. Depending on the issues and their impacts, different areas were delineated. The total estimated zoning of landslide risk (ZLR) was calculated as follows:
Value ZLR = L + SL+ ELE + SL/U-SL + DD+ URD + SFD + RF
Where, Value of ZLR = Sum of ratings of all the causative factors, ZLR = Litology + Slope+ Elevation + Soil/Use Soil + Drainage Density+ Urban Road Density + Structural Density + Rainfall.
The different thematic layers were reclassified using the Jenks method, which is based on Jenks’ natural break algorithm, thereby minimizing the internal variability of the classes and maximizing the differences between classes. In addition, the Latent Semantic Indexing (ISL – Latent Semantic Indexing) was used to prepare the risk susceptibility map (RSM), whereby all the layers of the map were superimposed and validated using the landslide incidence points collected during fieldwork. Based on this methodology and through the use of the ArcGis software, several thematic maps based on and related to the digital elevation model (DME) were generated: General geological map, elevations, slope, aspect, drainage, land / vegetation use, precipitation (rainfall)and as a final product, a susceptibility risk map.
IV.RESULTS
1.-Landslide susceptibility analysis
1.1Landslide inventory
It is very important to determine the location and area of the landslide correctly when preparing landslide susceptibilitymaps. The landslide inventory is an essential part and basic information for any landslide zoning, such as zones ofsusceptibility, risk, and danger. It involves the location, classification, volume, travel distance, activity status, and date ofoccurrence of the landslide in an area (Fell et al. 2008a). There was no inventory for the study area since previous studieson the subject of urban settlement-scale risk susceptibility had not been carried out.
The inventory of landslides was determined from field records and visual interpretation of aerial photographs and satelliteimages. In this study, field registration resulted in nine landslides (fall rocks, debris flow). Most of the landslides identifiedin this region have occurred in areas close to the VistaHermosa urban settlement, with the severity and high rainfall inhurricane seasons as the triggering factor.
1.2 Elevation
The area has a low relative relief that refers to the difference between the highest altitude (306m) and the lowest in anarea (100m), distributed in a narrow form in its southern portion and to the north it expands until reaching the Gulf ofCalifornia, forming the Valley of La Paz and delimited by the La Paz fault. The highest values indicate in the relief the presence of faults and fractures of a local nature, and that is a consequence ofthe regional faulting, denoting a mature topography.
These conditions influence risk susceptibility agents to play a vital role in the vulnerability of urban settlements, thetransport network, and the land. The study area is delimited by two high-flow streams in hurricane season where the reliefplays a factor that influences its volume and speed of currents. All this consequently increases the risk of flooding. Thereis a relatively medium variation in the relative relief (Figure 8 (A) that ranges from low altitude to high altitude: The classfor the relative relief factor (elevation) varies from 0.0-306 and the assigned weight (15) of relative relief were classifiedaccording to the influence on landslide susceptibility. Higher altitude above 254m was assigned a higher class of 306, amoderate altitude of 150-200m as assigned mean grade of 21.6-32.4, and low altitude below 100m was assigned a class very low (76).
1.3 Geology
The region of La Paz, geologically, is part of two geological provinces proposed by Ortega-Gutiérrez et al., (1992), to the S-SE we find the Plutonic Complex Geological Province of La Paz and to the NW is the Geological Province Faja Volcánica de La Giganta (Figure 9 (B). The provinces contrast lithologically, stratigraphically and geochronologically. A large part of the city of La Paz is located within the province of the La Giganta Volcanic Belt, which is characterized by volcanic and volcanosedimentary rocks grouped as the Comondú Formation of mainly late Oligocene-Miocene age (McFall, 1968; Hausback, 1984; Aranda-Gómez and Pérez-Venzor, 1986; Aranda-Gómez and Pérez-Venzor, 1988; Umhoefer et al., 2001; Drake, 2005; Camarena-Vázquez, 2018). While the La Paz Plutonic Complex outcrops to the NE and SE of the City of La Paz. This province is characterized by several pre-Cretaceous metamorphic complexes, Cretaceous granititoids, and Cenozoic sedimentary basins (Aranda-Gómez and Pérez-Venzor; 1988 and 1989; Gutierrez-Martinez and Sethi; 1997; Schaaf et al., 2000; Pérez-Venzor, 2013; Camarena-Vázquez, 2015: Rochín-Garcia, 2015).


Figure 8-9.- Thematic maps of the two factors involved in the landslide susceptibility analysis. A: Elevation, B: Slope aspect
Slope aspect
The aspect defines the direction of the downward slope of the maximum rate of change or the direction of the steepestslope in the x-y plane. The slope aspect values indicate the directions that slopes face. We can classify the aspect directionsbased on the angle of the slope with a descriptive direction. The aspect is important to understand the stability of theslope. In general, slopes from the northeast (NE) to southeast (SE) are relatively more susceptible to slope failure andlandslide activities. The classes of aspects were classified according to the stability of the slope. The current aspect of thestudy area was classified into 6 classes divided into geographic quadrants, with the aspect dominating the NE-SEorientation with 75% of the area and a lower percentage (25%) appearance in SW-NW orientation (Figure 10 (C).
Slope The slope can be defined as the vertical slope between the top of the hill and the bottom of the valley, meets the horizontalline, and is generally expressed in degrees, Strahler (1964).
Based on which the Digital Elevation Model (DEM) has been generated. DEM as an input parameter for slope. In thestudy area, there are 6 categories of slope classes and they are 0–4.6°, 4.6°–11.3°, 11.3°–19.2°, 19.2°–27.2°, 27.2°–36.2°,36.2°–65.4 ° (Figure…). The study area shows, in general, the northwest-southwest (NE-SE) slopes with 97% ofthe total area and representing 310,400m2 and 3% (9,600m2) behaving with a northeast-southeast slope(19.2-27.2°),which is more susceptible to slope failure and landslide (Figure…). The weight for the slope factor is 16. The slopeclasses were classified based on the stability of the slope; the highest rating was assigned to the NE-SE with a class of32.4-43.4, followed by the northeast-southeast (10.8-21.6), the lowest rating was assigned to the plane terrain with 0°-4.6°(Figure 11(D).


Figure 10-11-Thematic maps of the two factors involved in the landslide susceptibility analysis.
3.Slope aspect,
3.1 Slope
3.1.1 Density of structures
The density of structures (faults and fractures) and their density in lithological outcrops are two factors that are often usedfor GIS-based landslide vulnerability analysis (Figure 12 (E). Several studies have found that guidelines directly influencethe occurrence of landslides (Atkinson and Massari 1998; Pachauri et al., 1998; Suzen and Doyuran 2004; Lee, 2007). Inthis study, the Geological Resistance Index (GSI), introduced by Hoek (1994), Hoek et al., (1995) and Hoek and Brown(1998) that provide a system to estimate the reduction in resistance of rock mass for different geological conditionsidentified by field observations, based on the visual impression of the rock structure, in terms of blockage and surfacecondition of discontinuities indicated by roughness and joint alteration (Table 1; from Hoek and Brown 1998).
In the study area, 4 RGI values were detected and classified, and two faults of normal components and oneinferred fault (NE strike / SW Dip) that crossed the urban settlement, VistaHermosa, with a buffer zone. The densityof the lineaments was 25 m. Therefore, the weight given to this factor was 8 with the subdivision of five classes withvalues from the highest of 25 (Index 40) that corresponds to the normal and inferred faulting detected in the study areaand lower (6 to 9 representing the fracturing).


Figure12-13.-Thematic maps of the two factors involved in the landslide susceptibility analysis. E:Fractures density.
5. Vegetation
5.1Use/soil cover/Vegetation
In general, land use/ground cover affects the resistance of slope materials against sliding and the control of slope water content. It reflects the relationships between land use, risk and susceptibility to natural disasters. So, the loss of forest vegetation leads to a reduction in soil cohesion and a decrease in the shear strength of the soil profile. As a result, the slope becomes more susceptible to landslides and the return time of landslides decreases. The study area is characterized by its urban use in 95% and the rest as commercial, school and government office areas, located in the relief of low to intermediate elevations (50-200m), with slopes of 25°-30° of the total area (320,000 m2). The majority of the vegetation is introduced and the rest is endemic semi-desert type (xerophilus scrub-Cactaceae) (Figure 13 (F).
5.2Distance to the road
Distance to the road is one of the important parameters in the preparation of landslide vulnerability maps. The distance to the road parameter reflects human activities (Pourghasemi et al., 2009). In other words, landslides can occur on road-intersecting slopes (Nielsen et al, 1979). According to recent studies, cutting highway slopes construction vibrations and frequency caused by automobiles induce landslides (Mittal et al., 2008, Yalcin 2008). Roads change the nature of the topography, decrease the cut resistance of the toe of the slope, and cause tensile stress. In the present study, the main urban roads are observed and this factor was divided into 5 classes with weights from 0 to 28, giving it a weight of 10 (Figure 13). The range distance from 0 to 25 m for each urban road divided into 5 ranges of 5m each (Figure14), so the distances from the class to the road are classified according to vulnerability. The shorter distance from the main road is more prone to landslides, which is awarded for a higher rating of 20-25m (index 40-50), followed by an intermediate of 15-20m (index 30-40) and the lowest weighting of the index (0-30) it occurred at 0-20 m.

Figure 14.- Map which represents the distance to the road is one of the important parameters in the preparation of landslide vulnerability maps.
5.2.3Drainage density
The general drainage pattern is a dendritic to subdendritic pattern, which is represented in the study area by two streamsof intermittent flow due to the climatic regime of the region. A mathematical expression of the drainage morphometry ofan area is the drainage density, which is a measure of the length of the stream channel per unit area of the drainage basin[Drain density (Dd) = Length of stream (L) / Basin area (A)]. Drainage density measurement is useful in determininglandscape probability of slope failure. The drainage density in the study area can be classified as very low density (0-100 m/m2) to very high density in times of hurricanes (300-364.97 m/m2). In the study area, approximately 95% of the area belongs to thelow-density categories (Figure 14 (G). The drainage density classes were classified according to landslide vulnerability. Very high density is more vulnerablein this area, so the upper class 238.9-298 is assigned values for the medium classes of 59.7-179.2, and low density for theassigned class of 0.0-59.7 (Figure 7).


Figure 15-16.-Thematic maps of the two factors involved in the landslide susceptibility analysis. H: Drainage density.
6.Precipitation
6.1Precipitation
Rainfall as a risk factor is important for the region and study area since the hydrometeorological conditions produce alarge number of hurricanes and storms. All this produces a high susceptibility to flash floods and consequently, this canbe a trigger for landslides, fallen rocks, and / or debris flows. Therefore, the rainfall has been considered as one of themain parameters in the production of landslide maps.
Water infiltrates rapidly with heavy rains and increases the degreeof saturation and the potential for landslides to occur (Pourghasemi et al., 2009). In general, the study area is formed bya valley surrounded by hills of medium altitude (300m) and with a semi-desert climate. In the present study, 5climatological stations were taken (El Cajoncito, Aeropuerto Viejo, La Paz-DGE, La Paz-OBS, and Lagunillas) near the Vista Hermosa urban settlement to study the rainfall (Figure 16 (I) The rainfall factor was determined in classes> 100 to<100mm/ year that gave an index of 10 and 15 respectively. Rain on its thematic map was classified into 5categories, which are subdivided into ranges from 0 mm/year to 90 mm/year. The category assigned to the study areawas given at 0-190mm/year.
V. RESULTS
The urban geology of the study area is characterized by an isolated sequence of rock outcrops in its NNE portion, which are mainly made up of volcanic and vulcanosedimentary rocks. This lithology is grouped into the recognized Comondú Formation within the area in which its geomechanical condition and its anthropic action stand out. The lithological conditions and their characterization are related to other factors (hydrogeological, hydrometeorological, and geomechanical) that generate mass elimination movements and rock blocks.
The sliding processes (rockfalls and debris flow) are represented with 80% of the events only by a single lithology: Rhyodacite. The distribution of these events was located within the slopes found in the upper and middle parts of the topography (slopes from 15° to 22°). Based on the above conditions, falling processes and / or rock flows were recognized 6 they occur in two ways:
a. Events that occur in the rock (materials of greater competition) that correspond to blocks of riodacitic composition that are on a topographic slope of 25° and vary in dimensions from 2 to 4 m in length, which approximate by a weight of 4 tons each.
b. A massive bundle of volcanic clasts (debris flow) that are classified as less competent materials.
In particular, thiscategory includes inconsistent material, corresponding to volcanic lithology (unsold pyroclastic deposits). These events are simple blockages and/or translational landslides, which have a great influence on the factors of structuralgeology, erosion, and gravity as sliding mechanisms. Of these two sets, only 3 landslides in individual rock blocks and 1 debris flow (high temperature volcanic clastic deposits), without soil identification in these processes in the area. Both occur in events mainly in downward movements, such as simple translation and block sliding that end as slow-motion flows according to the classification of Dikau et al., (1996). Being the failure mechanism and the separation mode controlled by geological and geotechnical factors. The volumes of rock material removed in each removal process vary from the order of meters to hundreds of cubic meters and the displacements of individual blocks (rockfalls) reach up to 3 to tons of weight.
Furthermore, this area is limited by the current that crosses the northern part of the VistaHermosa urban settlement and, in turn, coincides with some urban settlements, since they are established on the very close margins of hills and streams.
This condition of geohydrology and hydrometeorology denotes poor urban planning and a high risk for its population when it is installed in flood zones.The results and conclusions agree with the descriptive determination of the GSI of each of the lithology observed and studied (lithological units: Rhyodacite, tuff, sandstone,conglomerate) that confirms the geotechnical characteristics of a rock mass class I and Class II will be classified as very good to good, that is to say that it is a hard rocky massif, little fractured, without representative filtrations and slight or little weathering, it represents very few problems compared to its stability and resistance, therefore, it is deduced that it will have a high bearing capacity will allow the excavation of slopes with high slopes and it will not be necessary to implement stabilization and reinforcement measures in tunnels.The results obtained based on the geotechnical characterization (Geological Resistance Index (GRI)) turns out to be very homogeneous and close in parameters, since it is a volcanic and vulcanosedimentary lithology with a similar genesis in processes and time of evolution.

Figure 16.-Table of Geological Strength Index (IGR), which shows the degree of distribution of structural discontinuities (fractures) of the study area the arrow shows the progression from Class I to II.
The results of this work will allow in the long term to make susceptibility maps to geological risks centered on the scale of the city of La Paz, which in turn can be projected to other urban areas of the State of Baja California Sur. All this aims to form a geotechnical-based tool to achieve a sustainable vision of our environment and physical environment that leads to a future sustainable urban development in the state of Baja California Sur., Mexico.
Finally, it is considered that this type of zoning of areas susceptible to risks (urban settlement scale) has been carried out in an almost globally low percentage, considering the scale used for the present study (1: 6,000), which provides an analysis of the risk conditions where the citizen of any city can be located in his community and know his conditions of civil protection. Unlike most risk studies that offer results on very large scales and only offer low-resolution insight into this problem (Figure 17).

Figure 17. – Geo-hazard susceptibility map of the VistaHermosa urban settlement, La Paz., BCS, Mexico.
The importance of knowing and disseminating this information is to begin the application of the Urban Development Plan (PDU), which is the governing document for the orderly growth of our city and municipality. In the case of the VistaHermosa urban neighborhood, corrective actions must be taken. of characteristics of adequate land use, modifications and geotechnical adjustments in areas vulnerable to flooding, landslides and/or debris flow. The vulnerable population generally comprises 365 households, with an approximate population of 1,547 inhabitants.

Figure 18.-Distribution of areas and percentages that represent the susceptibility of geohazards in the study area.
From the analysis (Figure19), it is evident that 31.28% of the total area of the area dominates with a very high and 25.46 high risk of susceptibility, followed by the zones of medium susceptibility (20.77%), and this trend of low-very low risk only represents the 14.89-7.58% respectively.

Table 2 of susceptibility distribution in the study area.
VI.DISCUSSION
Natural disasters pose several dangers, destroying communities, destroying livelihoods, and posing a risk to both human health and safety. The use of GIS technology to analyze trends in areas susceptible to natural disasters is an essential part of disaster preparedness. These will be urban areas or populations with seismic activity, areas with potential flooding, areas with potential landslides, volcanic activity, etc. These GIS-managed databases can be used to benefit and provide these areas with a better understanding of the situations and disasters that surround them. The spatial distribution of landslides is the consequence of different climatic situations and environmental settings, including topography, morphology, hydrology, lithology, and land use conditions.
In slope stability analysis, lithology and geological structure can be considered constant over long periods whereas morphology, climate, and land use can be affected by major modifications seasonally or over a period of decades. Changes in land use distribution and type can be natural or induced and controlled by human actions. Recent studies focusing on the effect of human-induced land use changes on slope stability have shown that in populated regions, the impact of humans on the environment contributes significantly to the initiation and reactivation of landslides (e.g., Vanacker et al. 2003; Meusburger and Alewell 2008; Van Den Eeckhaut et al. 2009). In Mexico, it’s estimated that more than 87.7 million people live in areas at high risk of natural and climatic disasters. The disasters related to these events between 2000 and 2016, including the 2017 earthquakes, caused substantial damage to more than 1.4 million housing units. Disasters related to climate change caused 82.6% of these damages, while natural disasters represented 17.4%. In total, the damages were valued at USD 20.6 billion (MXN 380.6 billion).
The methodology (AHP) of this research work to determine susceptibility is an adaptation of the matrix method to a GIS, and it has been tested and validated in different areas of the world and the result was the generation of vulnerability (susceptibility) maps in geological risks that for the first time focus on different geological problems of the urban and suburban area of La Paz, Mexico. All of this can be used as a basis for the future sustainable urban development of the city of La Paz. These areas include urban development zones where streams and stream flooding areas are currently found, as well as hill slopes, with processes susceptible to landslides in two usual types (rockfalls and debris flows).
The location and description of the phenomena were carried out in two groups: the one that occurred in the rock (materials with greater competition) and the one that occurred in rocks with less competition. In particular, this category includes incoherent material of volcanic origin (unsoldered pyroclastic deposits) and extended material, including immature soils. Of these two sets, 9 landslides (rock falls) and 1 debris flow (volcanic deposits or severely weathered rocks) were identified. The rock movements found in the area correspond mainly to the classification of Dikau et al., (1996) and Cruden and Varnes (1996) of fall processes, simple transition landslides.
On the other hand, those that occur in materials of the soil type correspond to events that begin as translational or rotational slides that end as flows. The volumes of rock material removed in each removal process range from meters to hundreds of cubic meters. In most cases, the events were located within the concave parts of the slopes at high to intermediate topographic levels.
The movements were generated from the combination of geological factors (slope, lithology and geological structure), hydrogeological (drainage density), and geotechnical (mechanical behavior of rocks and soils). The failure mechanism and detachment mode were controlled by geological and geotechnical factors.This aspect of the results coincides with the research carried out by Momeni et al., 2015, and Ahmed, 2015, stating that in landslides and falling rocks, the slope and appearance play an elementary role in the material flow, since the slope provides speed and the appearance indicates the direction of that slope. The proposed methodology also stands out, the possibility of evaluating the susceptibility conditions at the State and regional scale, complementing this work with statistical methods, as other authors have done (Varnes et al., 1984., Chacon et al., 2007).
These phenomena coincide in the location of urban settlements of this type that are established at the foot of the existing topography. Therefore, it is considered convenient to carry out more in-depth studies on the aspects generated by these landslide processes. For this reason, the next objective in the study area is the location of threats and prediction, through real-time monitoring and critical thresholds of precipitation as mentioned by Hervas et al., 2003, essential tools for implementation of early warning systems.
Mapping the susceptibility and the danger of landslides is very necessary nowadays due to the strong impact of these processes on people and their property. Susceptibility maps are very useful, but hazard maps are a significant improvement because they can solve the problem less conservatively and more reliably. However, the main obstacle to this landslide mapping is dating or at least determining its activity in a given period (return period). Some studies propose a methodology to determine the susceptibility in different periods of return of inventories of landslides with certain activities in these periods. Based on stereoscopic and monoscopic analysis of aerial photographs of different dates, geomorphic criteria and the study of rain time series (Fernandez et al., 2015).
VII.CONCLUSIONS
This contribution to the investigation of the current susceptibility of geo-hazards presented a methodological model (AHP methodology) for the evaluation, zoning of the susceptibility of geographic risks according to the characteristics of the study area.It also highlights the possibility of continuing to use this methodology, to evaluate susceptibility conditions at the state and regional level, complementing this work with statistical methods and the generation of an inventory of landslides (massive and fallen movements), which will allow comparing their results and coherence in the distribution of the occurrence of all present and future landslides. The methodological proposal also complements the results obtained with a new landslide inventory (rockfalls-debris flow), a landslide susceptibility map, which did not exist to date and which allows defining urban areas of urban development sensitive to urban settlement scale. The conclusions of this research work are presented below:
* The conditions of the physical environment, which were used to weigh the most influential factors for the landslide susceptibility (debris flow and rockfalls), can be inferred that geo-mechanics conditions, lithology, slope, geomorphology, IGR Index (elevation) are the most dominant factors. * According to the analysis of the most influential factors for landslide activity (judging by their associated weights) are lithology (20), geomorphology (16), slope (15), land cover/use (14), drainage density (12) and The three factors that least influence are urban density roads (10), the density of structural features (8) and rainfall (precipitation) (5).
* In terms of criticality and based on the validation of the susceptibility maps obtained, 20% of the total area has high to very high geographic risk susceptibility conditions.
* The percentage of very low to medium susceptible areas is close to the maximum 80% (79.97%).
* The proximity of urban areas to these landslide-prone and tumbled-rock areas is very close, as they are established on the margins very close to hills and streams. This susceptibility to geo-dangers, as well as the geohydrological and hydrometeorological conditions where the urban development of the different urban colonies is located, denotes little urban planning.
* The results represent the first stage of a large-scale project that began in 2018, which aims to zoning the geological and geo-hydrological risks of the entire State of Baja California Sur., Mexico and contribute new geotechnical knowledge to be used in construction regulations, as well as planning and sustainable urban development. The author thanks to the Technological Institute of La Paz for the logistical support provided.
REFERENCES
- Alcántara–Ayala, I.,2000,Landslides: ¿Deslizamientos o movimientos del terreno? Definición, clasificaciones y terminología, Investigaciones Geográficas, Boletín, núm. 41, Instituto de Geografía, UNAM, México, pp. 7–25.
- Aranda-Gómez, J.J., y Pérez-Venzor, J.A., 1989a, Estratigrafía del Complejo Cristalino de la región de Todos Santos, Estado de Baja California Sur. Universidad Nacional Autónoma de México, Instituto de Geología, Revista, v. 8, p. 149-170.
- Aranda-Gómez, J. J., y Pérez-Venzor, J.A., 1989b, La Evolución geológica del Complejo Cristalino Mesozoico a lo largo de la zona de falla de La Paz, Baja California Sur. Tercer simposium sobre Geología Regional de México. Organizado por Universidad Nacional Autónoma de México, Instituto de Geología, del 29 al 30 de mayo, resumen en memorias, p.11
- Akgün, A., & Bulut, F.,2007,GIS-Based Landslide Susceptibility for Arsin-Yomra (Trabzon, North Turkey) Region. Environmental Geology, 51, 1377-1387.https://doi.org/10.1007/s00254-006-0435-6.
- Ayalew, L. and Yamagishi, H.,2005, “The application of GIS-based Logistic regression for landslide susceptibility mapping in the Kakuda-Yahiko Mountains, Central Japan,” Geomorphology, 65, 15-31.
- Chacón J, Irigaray C, Fernández T, El Hamdouni R, (2007) Engineering geology maps: landslides and geographical information systems (GIS). Bull. Eng. Geol. Environ.65, 341–411.
- Cruden DM, Varnes DJ (1996) Landslide types and processes. In: Turner A. ; Shuster R. L. (eds) Landslides: Investigation and Mitigation Transp Res Board, 1996, Spec. Rep. 247, pp 36–75.
- Crutcher, H.L., and Quayle, R.G., 1974, Mariners worldwide climatic guide to tropical storms at sea: Naval Weather Service Environmental Detachment, Asheville, NC, 426 pp.
- Cruz-Falcón,A., Vázquez-González,R.,Ramírez-Hernández, J.,Nava-Sánchez, E.H.,Troyo-Diéguez, E., Rivera-Rosas,J., J.Vega-Mayagoitia, J. E.,2011, Precipitación y recarga en la cuenca de La Paz, B.C.S. Universidad y Ciencia, 27 (3), pp. 251-263.
- Dai, A., 2001, Global precipitation and thunderstorm frequencies. Part I: Seasonal and interannual variations. J. Climate,14, 1092–1111
- Dikau R, Brunsden D, Schrott, L. & M.-L, Ibsen (Eds.) .,1996, Landslide Recognition. Identification, Movement, and Causes. Wiley & Sons, Chichester.
- EPOCH (European Community Programme) (1993). Temporal occurrence and forecasting of landslides In the European Community, Flageollet, J. C. (ed.), 3 volumes, Contract no 90 0025.
- Fernández T, Pérezac JL, Cardenalac FJ, López A, Gómez, JM, Colomo, C, Delgado J. and Sánchez, M.,2015, Use of a light UAV and photogrammetric techniques to study the evolution of a landslide in Jaén (Southern Spain). Int. Arch. Photogramm Remote Sens. Spatial Inf. Sci., XL-3/W, 3241–3248.
- Gupta, R.P. and Joshi, B.C. (1990) Landslide Hazard Zonation Using the GIS Approach—A Case study from the Ramganga Catchment, Himalayas. Engineering Geology, 28, 119-131.http://dx.doi.org/10.1016/0013-7952(90)90037-2.
- Hausback, B. P., 1983, An extensive volatile-charged rhyodacite flow, Baja California, Mexico: Geol. Soc. America, Abstr. with v. 15, p. 281 (abstract).
- Hervas J, Barredo J, Rosin P, Pasuto A, Mantovani F, & Silvano S (2003) ‘Monitoring landslides from optical remotely sensed imagery: the case history of Tessina landslide, Italy’, Geomorphology 54, 63–75.
- Hirales-Rochin, J., Urcadiz-Cazares, F. J., 2018, Geohazards associated with the urban geology of the city of La Paz, B.C.S., México (northwest portion). AEG News, vol. 61, no. 4, pp. 32-37.September 15-23, 2018.San Francisco, California.
- Hirales-Rochin, J., Urcadiz-Cazares, F. J.,2019, Geohazards associated with urban geology in the City of La Paz Baja California Sur., Mexico: AEG News, vol. 62, no. 3, pp. 32-37
- Hirales-Rochin, J.,2020, Risk Susceptibility Mapping Based on the Urban Geology of the City of La Paz, B.C.S., Mexico(NE-SE portion):AEG News,vol.63 no.3,pp.29-35.
- Hirales-Rochin, J.,2020, Analysis of Geohydrological Risks based on SR & GIS from the Z Autónoma de México (UNAM), Tesis doctoral,225 pp.
- Ortega-Gutiérrez, F., 1982. Evolución magnética y metamórfica del complejo cristalino de La Paz, Baja California Sur., Soc. Geológica Mexicana, Convención Nacional, Programas y Resúmenes. México D.F, p. 90.
- Oropeza O. (2008). Prevención de desastres de origen hidrometeorológico, una prioridad nacional. El caso de las inundaciones. En: Rodríguez, D., S. Lucatello y M. Garza (Coordinadores). Políticas Públicas y Desastres. Instituto Mora-Red Mexicana de Estudios Interdisciplinarios para la Prevención de Desastres, A.C. México, D. F. Pp. 125-144.
- Pérez-Venzor, J.A., 2013, Estudio Geológico –Geoquímico del Borde Oriental del Bloque de los Cabos Baja California Sur, México: México, D.F., Universidad Nacional Autónoma de México. tesis doctoral. 297 pp.
- Rojas-Soriano, H., Alvarez-ArellanoA.D.2007.Zonas de peligro por inundación y erosión en el área de Cabo San Lucas, B.C.S., México. Jornadas Internacionales sobre Gestión del Riesgo de Inundaciones y Deslizamientos de Laderas.Brasil.15 pp.
- Romero-Vadillo, E., Romero-Vadillo, I.R, 2010, Plan de acción ante cambio climático del Estado de Baja California Sur: Ciclones tropicales (PEACC-BCS), Universidad Autónoma de Baja California Sur, Reporte, 23 pp.
- Schaaf, P., Bohnel, H., and Pérez-Venzor, J.A., 2000, Pre-Miocene palaeogeography of the Los Cabos Block, Baja California Sur: Geochronological and palaeomagnetic constraints: Tectonophysics, v. 318, p. 53–69.
- Selby, M. J. (1993), Hillslope material and process, Oxford University Press, pp. 5-82
- Tangestani, M. H.: Landslide susceptibility mapping using the fuzzy gamma approach in a GIS, Kakan catchment area, southwest Iran, Australian J. Earth Sci., 51, 439–450, 2004.
- Terzaghi K (1950).Mechanism of Landslides. Application of Geology to Engineering Practice, Berkey, Geological Society of America, p. 83–123.
- Vanacker V, Vanderschaeghe M, Govers G, Willems E, Poesen J, Deckers J, De Bievre B.,2003. Linking hydrological, infinite slope stability and land-use change models through GIS for assessing the impact of deforestation on slope stability in high Andean watersheds. Geomorphology 52:299–315
- Varnes, DJ (1984) Landslide hazard zonation: a review of principles and practice. Commission on Landslides of the IAEG, UNESCO, Paris. Natural Hazards Series 3, p. 63
- Vega-Granillo, E.L., Vega-Granillo R., De la O-Villanueva M.Araux-Sánchez E. 2004.Geología Urbana de la región de Guaymas y San Carlos, Revista GEOS, V. 24, No. 2.p-188.