
Abstract– The research presents the multi-criteria analysis approach (MCA) to describe the effective use of geospatial techniques for the reduction of geohydrological risk and its relationship with urban territorial development at the local level, in the case of the La Paz Basin, Baja California Sur., Mexico. In addition, Geology is presented as a tool to identify areas of geohydrological risk, useful to determine the close relationship between the geological space and the sustainable urban development of a city. From this interaction, it is possible to respond to the growing demand for environmental and urban solutions. Today’s cities are characterized by rapid and poorly planned urbanization, which, together with climate change, has exacerbated the risk of flooding in urban and rural areas globally, resulting in devastating loss of human life and property.At the national, regional and local level where the study area is located, floods are one of the most susceptible geohydrological hazards. The objective of this research is to identify these areas of risk of susceptibility to flooding and to make known the factors that influence it, such as the growing number of new urban areas, which are not linked to an adequate analysis of the hydrological geographic environment and little knowledge of the main factors that control these risk conditions.The methodology was based on a characterization of the geological and hydrogeological conditions of the basin of the city of La Paz; Mexico. The methodology of the Analytical Hierarchy Process (AHP) applied to generate the flood susceptibility map was built based on thirteen influencing parameters, that is, elevation, slope, distance from the drainage network, geomorphology, drainage density, flow accumulation, rainfall, land use / vegetation, geology, stream power index, topographic moisture index, and topography curvature. All this, through geographic information systems (Arcgis). The results represent the first stage of a larger-scale project with the purpose of updating the knowledge of vulnerability and geo-hydrological risks of the study area. Therefore, it is possible to contribute new knowledge to be used in a sustainable growth of the city’s population, the improvement of current construction standards and the corresponding zoning to anticipate its development in an orderly manner. Finally, it is considered that this type of zoning of areas susceptible to risks (urban settlement scale) provides an analysis of the risk conditions where the citizen of any city can be located in his own community and know his own conditions of civil protection. Knowledge that currently most risk studies only offer large-scale results and a broader vision.
Keywords: Analytical Hierarchy Process (AHP), geohydrological hazards, multi-criteria analysis approach (MCA)
I.INTRODUCTION
Natural hazards are phenomena that can cause significant damage to both natural and man-made environments, but their impact differs depending on the phenomenon, location, intensity, and frequency. The occurrence of floods is caused by abundant rains, but the potential effect of negative effects depends on the physical-geographical, geological, topographic, edaphological, vegetative and anthropological characteristics.
Geological and hydrometeorological risks are considered multi-risk hazards and are currently responsible for high rates of damage and destruction in urban areas, only in the 20th century it is estimated that more than a million people around the world have died because of them.
The United Nations (UN, 2002) has made known the importance of the multi-risk hazard assessment and affirms that this provides “An essential element for shaping a safer world in the 21st century”. Within these natural phenomena: Floods are considered the most recurrent and disastrous phenomena in almost all parts of the world (Doocy et al., 2013; Das, 2018a; Termeh et al., 2018). In Mexico annually more than 50% of the disasters that occur in the country are triggered by phenomena of hydrometeorological origin, including hurricanes and other types of torrential rains, floods, droughts, frosts and hailstorms, among others (Oropeza, 2008), being Low Southern California is the entity with an average cyclone incidence of a tropical cyclone in the Northeast Pacific and 2 approaches less than 300 km. Between 1966 and 2010, 39 cyclones have reached the entity, 20 of which have arrived in September (Vadillo, et al., 2014).
Conditions that place La Paz, Baja California Sur, Mexico as one of the states with the highest danger (Figure 1).

Fig 1. Mapa de peligros por huracanes (Modified CENAPRED, 2016)
In addition, considering that the volume of runoff (11 Mm3 / year, product of a precipitated volume of 351 Mm3 / year) by the streams that make up the La Paz Basin, BCS, extend and cross the urban center at low speeds (Monzalvo, 2010). However, it is impossible to prevent catastrophic floods and the implementation of appropriate methods can provide geomorphological efficiency, magnitude, and frequency (Wohl, 1992; Rajaguru et al., 1995; Gupta et al., 1999).
Furthermore, through these analyzes, disaster management can be made easier (Cloke and Pappenberger, 2009).
Therefore, flood risk management must overcome geographic locations and socioeconomic constraints (Degiorgis et al., 2012; Kazakis et al., 2015).
Currently, when it comes to climate change, the occurrence of floods is highly dynamic and catastrophic. Variations in climatic circumstances strongly affect the runoff of river currents, the rate of a thaw in the glacial region, evapotranspiration (Dobler et al., 2013; Fischer et al., 2016), and, therefore, the frequency and magnitude of floods (Kundzewicz, 2002; Pilling and Jones, 2002; Köplin et al., 2014).
In this context, various studies have focused on the assessment of multiple hazards using GIS methods that allowed the analysis of different data, the development of natural hazard models, and the estimation of vulnerability and risk for a particular region (El Morjani et al., 2007; Kappes et al., 2011; Schmidt et al., 2011; van Westen et al., 2008).
There are several heuristics, statistical and deterministic approaches that can be applied in natural hazard estimation and land-use suitability analysis (for example, Ayalew and Yamagishi, 2005; Guzzetti et al., 1999; Papadopoulou-Vrynioti et al., 2013b) In recent years, many researchers have performed hazard mapping and flood susceptibility analysis using remote sensing and GIS tools that provided considerable accuracy (Pradhan et al., 2009; Bates, 2006; Rahmati et al., 2016a, 2016b; Wanders et al., 2014; Fekete, 2009; Nikoo et al., 2016).
Examples of geospatial models in flood studies include analytical hierarchy processes (Chen et al., 2013; Kazakis et al., 2015; Rahmati et al., 2016b). Therefore, it is essential to understand the dynamics of floods.
Recent studies are based on the use of GIS tools and the application of the Analytical Hierarchy Process (AHP) in the evaluation of the land’s susceptibility to natural hazards and the analysis of territorial favorability in the context of sustainable territorial development. The AHP is a weight evaluation process that combines qualitative and quantitative factors to classify and evaluate alternative scenarios, among which the best solution is finally chosen (Saaty, 1990; Saaty, 2004).
Thus, an integrated approach to AHP within a GIS environment has gained wide application in the assessment of a single natural hazard (Fernández and Lutz, 2010; Karaman and Erden, 2014; Rozos et al., 2011), and multiple hazards. (Peng et al., 2012; Karaman, 2015), along with site selection and land-use suitability analysis (Bathrellos et al., 2012; Dai et al., 2001; Marinoni, 2004; Panagopoulos et al., 2012; Thapa and Murayama, 2008; Youssef et al., 2011). However, the AHP method has some disadvantages that lead to the decision-making process.
The application of AHP and GIS in an integrated way has been successful in several studies such as flood susceptibility mapping (Kazakis et al., 2015), delimitation of landfall, natural hazards (Fernandez and Lutz, 2010; Singh et al., 2011), and geoenvironmental studies (Singh et al., 2016; Patra et al., 2018).
Recently, this methodology has been applied in areas of local scale (urban settlement) in the capital city of La Paz with the characterization of the susceptibility of geo-hazards in different urban areas (Hirales-Rochin, and Cazares-Urcadiz, 2018, Hirales-Rochin, 2019, Hirales-Rochin, 2020).
Key factors contributing to flood susceptibility are elevation, slope, and distance from drainage network, geomorphology, drainage density, flow accumulation, rainfall, land use, geology, stream power index, Topographic moisture index, and curvature of the topography.
Based on the results obtained from the sustainability analysis, it is advisable to consider six or more susceptibility factors when developing flood susceptibility maps, especially factors related to surface runoff and flow accumulation. Therefore, the purpose of the study is to apply a flood risk assessment model correlated with all the geo-hydrological characteristics of the La Paz Basin, Baja California Sur., Mexico.
II. METHODS AND DATA
1. Study Zone:
La Paz basin is located in the southern part of the Baja California peninsula, Mexico where the city of La Paz is located (Figure 2). Within the Köppen classification, the dominant climates in the study area are very dry and very hot, with an average annual temperature that ranges between 22 ° C and 24 ° C.
The average annual precipitation in the basin is 265 mm (CNA 2005) that occurs intensely mainly during the summer, with the highest values in August and September with great influence from cyclonic-type atmospheric disturbances originating in the Pacific Ocean.
Geomorphologically it is characterized by a morphology dominated by basins and mountains, the result of the interaction of magmatic-tectonic processes, which is based on Holocene deposits that correspond to alluvial material (varying from sand to sandy gravel) of active streams, where the thickness of the material varies and can reach a few meters in the main streams (INEGI, 1995).
Geologically in the area, volcanic and volcanoclastic rocks (sandstones and volcanoclastic conglomerates, rhyolitic tuffs, andesitic lahars and lava flows) are represented by the Comondú Formation with an age between 30 and 12 Ma in the central portion (Aranda-Gómez and Pérez- Venzor, 1988, 1989 a and Ortega-Gutiérrez et. al., 1992; Pérez-Venzor, 2013).
2. La Paz basin:
A watershed is defined as a surface in the form of a “depression” that captures rainwater. Part of the water that falls to the ground evaporates, another infiltrates the subsoil, and the rest, once the subsoil is saturated, drains to the same place in the lower parts, which can be a lake, river, or the sea (Cruz -Falcón, 2007), in the case of the La Paz basin, the delimitation is between 580000-600000 and 2650000-2670000 UTM that covers an approximate area of 1,275 km2 to 1,571 km2 (Cruz-Falcón et al., 2011. , CONAGUA 2002).

Fig 2. Regional location of La Paz basin, Baja California Sur., Mexico.
3. Surface Flows and Floods:
In the La Paz Basin, there are no rivers that have permanent surface flows; however, the extension of the basin is defined by the intermittent streams originating in the Sierras de Las Cruces and El Novillo and the plain in which these are distributed runoff until it empties into the Bay of La Paz. Although the estimated area of the basin varies by study (CONAGUA 2002, Cruz-Falcón et al., 2007).

Fig 3. Hypsometric map showing the urban settlement with flood risks identified by the local authorities (Civil Protection) of the capital city of La Paz, Mexico.
The La Paz Basin includes the aquifer of the same name, extending beyond its limits to the waters of the mentioned mountains. These runoffs produce rapid drainage, which discourages infiltration and generates sudden runoffs that put those who live downstream of the streams at risk (Figure 3).
The city of La Paz, during the decades of the ’70s-’80s suffered periodic flood events due to the overflow of the El Cajoncito and El Piojillo streams, due to the occurrence of hurricanes.
Therefore, the construction of protection works was carried out, the purpose of which was to divert the flow of the El Cajoncito stream to the El Piojillo stream within the capital city of La Paz, Mexico.
However, this led to the growth of human settlements on the banks of the mentioned streams and, on September 30, 1976, the presence of Hurricane Liza produced an avenue that caused a failure of a board that protected the urbanized area, located within the old channel (El Cajoncito stream- Figure 4), thus causing a flood of serious consequences that caused the loss of human life and material damage of considerable importance.
Sudden runoff that reached a flow that exceeded 600 m3 / s in a very short time. Another factor for flooding is the urban growth of the city of La Paz in a southerly direction, all in a disorderly manner, without considering the surface hydrology that is already part of the urban area, where sudden runoff occurs and flood zones are generated.

Fig 4. Hurricane Liza caused great damage and loss of life in La Paz city, Baja California Sur., Mexico. https://nave gantecalifornio.wordpress.com/2013/09/23/ciclon-liza-1976-yo-sobrevivi-al-ciclon-liza-30-de-septiembre-1976/.
The City of La Paz registers an average of 18 rainy days per year for an average of 169.2 mm of rain, most of which occur in July, August, and September. Monsoons are mainly driven by the El Niño Southern Oscillation (ENSO) phenomenon (Cavazos and Hastenrath 1990), which averages 14.6 storms per season (Farfa´n and Fogel 2007) (Figure 5).
The mountainous area southeast of the city receives more rain per year than the City of La Paz, with 440 mm at the highest elevations (Sierra Las Trincheras-Sierra El Novillo) (Figure 5-6).

Fig 5. Map showing elevation (green), basin boundary (dark blue), roads (gray), and mean annual precipitation (high red, medium orange, low yellow) (Taken from Haeffner, Melissa, 2016)., & total precipitation captured per year for the La Paz basin, Mexico (Torres-Martinez et al., 2019).

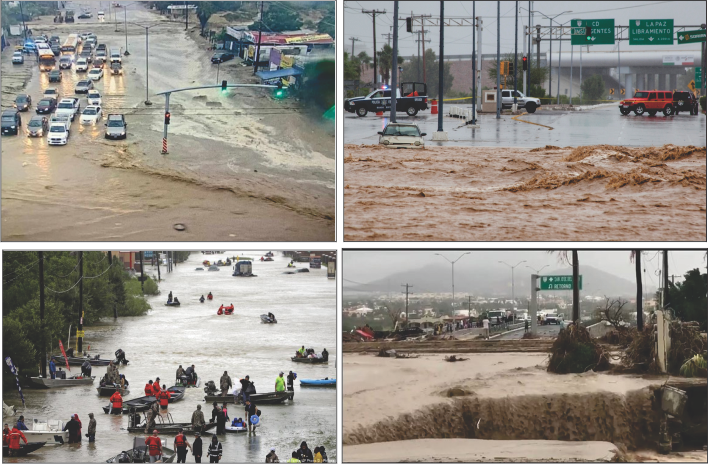
Fig 6. Floods effects differentlocalities of La Paz city.
III. DATABASE AND WORKING METHODS
Information was collected from different data sources and the database was developed in a geospatial environment (Arcgis). Thirteen susceptibility factors were selected based on literature reviews, which are flow accumulation, flow direction, distance to drainage network, elevation, annual precipitation, geology, slope, maximum slope, vegetation/land use, density of drainage, topographic flood index (TWI), river erosion index (SPI) and curvature.
These factors were then characterized based on a field study and flood records. Based on previous studies (Fernandez and Lutz, 2010; Elkhrachy, 2015; Bathrellos et al., 2012; Hong et al., 2018), the importance of each class of susceptibility to flooding is based on parameters such as flow accumulation, Annual precipitation, geology, distance from the drainage network, slope, runoff, soil type, elevation, SPI, TWI, and drainage density that are taken into account for the present study of the La Paz basin (Figure 7).

Fig 7. Flow diagram of the methodology used.
1. Analytical Hierarchy Process:
Saaty (1980) introduced the analytical hierarchy process (AHP) which is a semi-quantitative decision-making approach that uses weights by pairwise comparison between different factors without inconsistencies.
According to Saaty and Vargas (2001), the AHP method comprises several stages:
- Breakdown of a decision-making problem into component factors;
- Preparation of the components in hierarchical order;
- Based on the relative importance of each factor, assigning numerical values according to their relevance;
- Build a comparison matrix; and
- Calculation of normalized eigenvectors that determine the weights of each component.
The comparison of the different components is made by assigning scores based on their relative influences and relative importance (that is, 1. Equally significant; 3. Moderately more significant; 5. Strongly more significant; 7. Very strong-most significant; 9, 10, 11, 12extremely significant, and 2, 4, 6 and 8 are the transition scores). In the pairwise comparison matrix, the rows follow the inverse score of each component and its significance with another factor (Figure 7). For example, for the flood susceptibility model, elevation is slightly more important than slope; therefore, the elevation score is 1 and 2 for slope.
Therefore, in the following the maximum slope is scored ½ and a similar method is applied to all components. After that, a standardized pairwise comparison matrix is constructed where the diagonal elements are equal to 1, using the following expression:

(1)
The scores of the pairwise comparisons are normalized to calculate the standard pairwise comparison matrix using the weighted arithmetic method of the mean (Equation (1)) (Figure 7). Determinations of weights for all components are determined by the mean rows method on the standard pairwise comparison matrix. The maximum characteristic root can be expressed as:
(2)
The consistency of the AHP method is made by the following expression (Saaty, 1980):
(3)
While
(4)
Where CR is the consistency index (Equation (3)), CI represents the consistency index, RI represents the random index, λmax is the main eigenvalue of the matrix and n is the number of total components in the matrix (Equation (4)).
According to the article by Saaty (1980), the values of the random index (RI) are implemented to calculate the consistency relationship. The random index depends on the number of components in the comparison matrix. For this case study of the La Paz Basin, Mexico, and the number of parameters of 13, the RI value is 1.67 (Figure 7 and Figure 8) referring to the article by Saaty (1980).
In this study, if the value of the consistency index (CR) is <0.10, the calculation is accepted and indicates a reasonable precision for the pairwise comparison matrix. In case the CR is> 0.10, the comparison matrix indicates inconsistency, and the scores are readjusted according to Saaty (1977).
In the last phase, all the components contemplated in this research are evaluated separately and classified in subcategory orders. Therefore, it indicates that the CR values for all components are less than 0.10, which indicates that the preferences made in this study are very consistent (Figure 9).
Finally, integration of all the components and their weights in the Flood Susceptibility Index (FSI) is based on the weighted linear sum in the ArcGIS environment with the following expression:

(5)
Where FSI represents the flood susceptibility index, Wi is the weight value of each component, Ri is the weighted value of the component subcategory, n is the number of factors (Equation (5)).
There are several advantages to implementing the AHP method for flooding. Susceptibility analysis:
- The decision rules are based on the experience and knowledge of experts;
- All the information is taken into account for the structural judgment;
- The weights of each component are automatically calculated based on the principal eigenvector when consensus is reached and
- By using coherence index values, inconsistency can easily be detected and the entire calculation can be reviewed. The only disadvantage of the ahp method is that the factor ranking preference may differ from one investigator to another based on their knowledge, expertise, and experience.
Table 1. Rate values of each class for the adopted factors in flood hazard assessment.

Table 2. Normalized and the weight values in the standardized pair-wise comparison matrix.

2. Thematics Maps:
2.1 Elevation:
The elevation is the main factor in controlling flooding in an area (Botzen et al., 2012; Mojaddadi et al., 2017). Water that flows continuously from higher elevations to lower, flatter areas of the lowlands can flood faster than locations at higher elevations (Fernández and Lutz, 2010; Dahri and Habib, 2017). The elevation map is prepared based on SRTM DEM of 15 m spatial resolution and the classification is performed based on the natural Jenks break in ArcGIS (Figure 10).
2.2 Geology:
The temporary flooding of an area has a great capacity to affect the profile currently due to the variation of the geology (Reneau, 2000) and can be considered as an important factor since it amplifies the degree of flooding event (Xu et al., 2001; Kazakis et al., 2015). In addition, the geology of an area can provide substantial information on the occurrence of paleo-flood events.
In general, the geology that covers the La Paz-El Carrizal basin is characterized by a sequence of marine sediments and recent alluvial fans, made up of conglomerates and little consolidated and unconsolidated sediments of sands, silts and mudstones, conglomerate sandstones, and layers. intercalated phosphorite; the San Isidro formation (early Miocene) made up of glauconitic sandstones, conglo merates, shales, and some layers of pinkish rhyolitic tuffs; and the Comondú Formation (Upper Miocene) formed by sandstones and volcanoclastic conglomerates, rhyolitic tuffs, andesitic lahars, and lava flows.
Towards the northeast, there is a series of rocks from the Cretaceous to the Recent that form the Las Cruces and El Novillo mountain ranges (Figure 10), the first consisting of intrusive igneous rocks, mainly granite and tonalite, and the second consisting of gabbro.
2.3 Slope:
In hydrological evaluation, the slope of an area plays a fundamental role in regulating surface discharge. In such a hydrological study, it is a very important topographic factor (Pradhan, 2009; Tehrany et al., 2013; Manandhar, 2010,). Furthermore, the gradient partially controls the infiltration process. Surface runoff increases significantly as the slope increases; consequently, infiltration decreases (Das and Pardeshi, 2018b).
As a result, regions with a sudden decrease in slope, which have a higher probability of flooding due to massive volumes of water becoming stationary, causing a severe flood situation (Pradhan, 2009; Li et al. ., 2012).
2.4 Maximum Slope:
The aspect defines the direction of the downward slope of the maximum rate of change or the direction of the steepest slope in the x-y plane. The slope aspect values indicate the directions that slopes face. We can classify the aspect directions based on the angle of the slope with a descriptive direction. The aspect is important to understand the stability of the slope. In general, slopes from the northwest (NW) to southwest (SW) are relatively more susceptible to slope failure and landslide activities.
The classes of aspects were classified according to the stability of the slope. The current aspect of the study area was classified into 10 classes divided into geographic quadrants, with the aspect dominating the E-NW orientation with 60% of the area and a lower percentage (40%) appearance in NE-SE orientation (Figure 10).
2.5 Distances from Streams:
Distance to streams is vital in the level of sensitivity to flooding in the study area. Also, the distance from the drainage network data layer streams was compiled by using geoprocessing buffer routines. This factor is crucial for flood susceptibility mapping because areas that are closer to streams are more likely to flood during a flood event. Being in the La Paz basin the areas with the highest probability of flooding at distances of 50 to 100m (Figure 11).
2.6 Drainage Density:
A higher probability of flooding is strongly associated with higher drainage density, as it indicates higher surface runoff. It is the parameter that quantifies the degree of development of a hydrographic system and allows knowing its complexity (Fuentes Junco, 2004; Delgadillo and Páez, 2008). It is the relation between the total length (Lt) of the perennial, intermittent, and ephemeral watercourses, of a basin and its area (A) (Horton, 1932, 1945).
The higher the density of drainage, the runoff time is shorter, which is why it is considered as another indicator of danger and/or vulnerability.
2.7 Drainage Density:
The drainage density map of the La Paz basin, Mexico was calculated from the drainage network map using the line density command in ArcGIS. Kumar et al. (2011) indicated that greater surface runoff is generated in regions that have a higher drainage density compared to areas with low drainage density. Being for the case study an average density of the drainage network throughout the basin and presents some high variants in the elevated relief (Figure 10).
It is the essential element for the runoff to take place, since it depends on the intensity and frequency, the speed with which the soil saturates and the runoff begins.
A large number of previous pieces of works of literature establish the relationship between rainfall and the occurrence of floods in an area (Zhang and Smith, 2001; Rozalis et al., 2010). It cannot be determined exactly to what extent an increase in rainfall will cause a flood situation.
Instead, it can be said that rain is the main factor for the occurrence of floods in any environmental condition. For the flood potential mapping, rainfall was selected as one of the components influencing the principle by numerous researchers, worldwide (Tehrany et al., 2013a).
In the state of Baja California Sur, Mexico, two precipitation regimes are defined: The first includes its occurrence in July to October, seasonally that concentrates 75% of the total annual precipitation, and the remaining 25% is concentrated in December, January, and February where precipitation in the La Paz Basin, Mexico is seasonal and highly influenced by the presence of hurricanes from the Pacific Ocean.
2.8 Flow Direction:
Hydrologists use flow direction maps to help model how surface runoff contributes to flooding. Flow Direction calculates the direction the water will flow using the slope of the neighboring cells. The direction of flow is determined by the direction of the steepest descent, or the maximum fall, when the direction of the steepest descent is found, the output cell is encoded with the value representing that direction.
The direction of flow is based on a digital elevation model (MED), where the direction in which the water will flow in a given cell is determined, based on the direction of the steepest descent in each cell, formed in the MED the direction of flow. In addition, the difference of the Z-value and the slope (slope) is calculated between neighboring cells (Figure 10).
2.9 Vegetation / Land Use:
The most abundant soil in the state is regosol, it is distributed throughout the entire state. In most cases, it presents a lithic-type physical phase, shows a coarse texture in the high topographic areas, and a medium texture when it decreases. These soils have high permeability (Figure 9).
The frequency of flooding in an area can be strongly influenced by the land use pattern and its temporal evolution (Benito et al., 2010). According to García-Ruiz et al. (2008), the land use of an area is of paramount importance for hydrological responses in different periods.
Consequently, Beckers et al. (2013) showed that changes in land use can accelerate the probability of flooding in an area. In the case study, the use of land due to the disorderly urban development of the towns of the La Paz Basin, Mexico.
The vegetation cover is a factor considered in the evaluation of the runoff units, so its correct classification allows to obtain reliable results in the application of the respective method, the density, and type of vegetation cover intervene in the amount of runoff, acting as a retarder of this or promoting infiltration (Figure 11) The most outstanding plant communities in the study area are sarcocaule scrub, haze Sarco-crasicaule scrub, Sarco-crasicaule scrub, halophilic vegetation, sandy desert vegetation.
The most representative species are: Burserahindsiana (Copal), Burseramicrophylla (Torote colorado), Burseraodorata (Torote blanco), Jatropha cinérea (Lomboy), Jatrophacuneata (Matacora), Ambrosia dumosa (Herba del burro), Cercidiumfloridum (Palo green), Encelia farinosa (Frankincense), Fouquieria’spp. (Ocotillo, Palo adán), Larrea tridentata (Gobernadora), Olneyatesota (Palo fierro), Opuntiacholla (Choya), Pachycereuspringlei (Cardón), amongothers.
2.10 Curvature:
Topographic curvature is of crucial importance in the runoff and infiltration process of an area. Also, the vertical plane in a flow line; influences flow acceleration, erosion, and deposition rate. A convex curvature accelerates the process of flow and erosion, while a concave one influences the sedimentation process.
A study by Hudson and Kesel (2000) found that curvature between 1.0 and 2.0 has a higher probability of flooding. In the present study, the curvature is calculated in the ArcGIS environment using surface tools (Figure 11).
2.11 Flow Accumulation:
According to Kazakis et al. (2015) flow accumulation is one of the most essential parameters in flood mapping. The basic criterion used for its evaluation establishes that the greater the Accumulation of Flow in a given area (generally manifested as linear patterns associated with the drainage network), the greater the susceptibility to flooding; likewise, the lower the Flow Accumulation at a specific site, the lower the susceptibility to flooding.
In this article, the flow accumulation is generated from the elevation model in ArcGIS, using the flow accumulation command after calculating the flow direction for the La Paz Basin, Mexico (Figure 11).
2.12 Topographic Moisture Index (TWI):
Precipitation occurs irregularly in the entity; the pluviometric records annually average higher values in the southeast of the entity and as one ascend from the coast to the mountains, the maximum monthly precipitations.
The value of the isohyets increases towards the areas of greater height, therefore, it is directly proportional to the height.
The topographic moisture index is a physical representation of flood areas, which is an important component of a river catchment (Soulsby et al., 2010). As is the specific catchment area and is a measure of shallow surface or underground runoff at a given point in the landscape and angle that is the slope in degrees.
TWI of a basin indicates two types of measurements; they are flatlands and hydrographic positions (Papaioannou et al., 2015). There is a strong relationship between the geomorphology and the TWI of an area. TWI values are generally higher in floodplain environments.
Thus, the higher the value of this index, the more humidity the cell must present depending on its topographic configuration. TWI can be calculated using the following expression given by Moore et al., (1991):
2.13 Current Power Index (SPI):
This parameter has been widely used in erosion, sediment transport, and geomorphology studies as a measure of the erosive power of running water; discharge is assumed to be proportional to the drainage area.
According to Knighton (1999), the current power index is significantly important for many processes in the river environment. The catastrophic transformation of the channel, due to the high flow power is found in the study by Fuller (2008).
The current power index can be described as a significant behavior of streambed erosion and sediment transport (Barker et al., 2009; Hong et al., 2018a). Calculation of the power index of the current is based on the equation given by Moore et al. (1991): Where, as indicates the specific catchment area, and β represents the slope gradient.
In the present study, the SPI calculation is performed directly in SAGA GIS using a digital elevation model of the study area (Figure 11).

Fig 8. Thematic maps of the factors involved in the flood hazard analysis. A: Elevation, B: Geology, C: Slope, D: Maximum slope, E: Distance from streams, F: Drainage network, G: La Paz basin (MDE).

Fig 9. Thematic maps of the factors involved in the flood hazard analysis. H: Rainfall, I: Flow direction, J: Vegetation/ land use, K: Curvature, L: Accumulated flow, M:TWI (Topographic wetness index), N:SPI (Stream power index).
IV. RESULTS AND DISCUSSIONS
In this study, a flood hazard map was created for the La Paz Basin, B.C.S, Mexico, using AHP analysis. In the analysis, 13 factors were selected that play an important role in the occurrence of flash floods. The identified factors were included in a pair comparison matrix within an AHP, to determine their weights.
The flood susceptibility map of the La Paz basin, Mexico, presents different zones of spatial distribution throughout the study area according to the geo-hydrological conditions ((Figure 12-13-14).
The areas of the basin with ranges of susceptibility to floods vary from very high to high, it is greater in the Northeast and Northwest, western and central (67.89% -18.38%), of the basin with areas up to 288.87 Km2 (Figure 12). These zones coincide mainly along the main streams of the drainage network that dissect most of the basin and at their confluence with the main tributaries.
It is notable to note that in the NW portion mentioned there is no urban development to date, while in the NE portion it is characterized by the same dendritic drainage system formed by tributary streams that reach the central part of the basin very close to the city capital of La Paz, Mexico.
In turn, the southern and northern portion of the basin shows the medium to low ranges where the elevation and slope are lower, however, in the southern part the drainage density is high, which gives it a high potential for flooding by the accumulated flow. These characteristics represent a 3.20% to 6.64% and with area ranges from 50.32 to 60.69 Km2 of the total La Paz basin (Figure 14).
The municipality of La Paz is made up of the city of the same name, the towns of Todos Santos and El Centenario, the hamlets of El Pescadero, Chametla, Colonia Calafia, MelitónAlbáñezDomínguez, Los Barriles, El Sargento, San Juan de Los Planes, General Juan Domínguez Cota, El Cachanilla, El Carrizal and San Pedro, as well as 1,030 rancherías ranging from 1 to 463 inhabitants. Within the La Paz Basin, there are 15 of these main populations that have a majority distribution throughout the hydrographic network of the same basin. Therefore, the risk of floods is an important issue for these communities, and this type of threat must be taken into account when implementing territorial development strategies focused on aspects of risk susceptibility.
In general, the runoff produced in B.C.S., Mexico, and the La Paz basin are produced by a regime of normal rains, which infiltrate along the channels, so they do not reach the sea or only discharge into it, insignificant flows; on the contrary, cyclonic rains originate large avenues that flow into the sea.
Table 3. Table of susceptibility ranges.

The hydrological response of a basin depends on its physiographic characteristics. Two groups have been defined: slow floods and fast floods. This means that in basins whose hydrological response is slow, floods are generated in a relatively long time (on the order of several hours or days); material damage occurs mainly in them. Whereas when the flood forms in a short time (from a few minutes to a couple of hours) it is called a flash flood, causing, mainly, the loss of human life in populated areas.
In summer Baja California Sur is subject to the action of tropical storms and cyclones; in much of its territory; coupled with the cold fronts that occur in winter. They produce very intense precipitations, although, of short duration and extension, this diversity of meteorological conditions produces extreme runoffs and floods.
The urbanization of a basin modifies the hydrological response to a specific rainfall, due to the construction of houses, streets, sidewalks, and parking lots that increase waterproofing. The effects of this waterproofing are several, for example, the rain no longer infiltrates, and therefore the volume of runoff increases, the surface is smoother, so it transports the flow more efficiently and there is less storage.

Fig 10. The flood hazard assessment map.
This leads to the alteration of the natural drainage networks, such as the construction of collectors and canalizations that increase the speed of runoff downstream of the basin and increase the impervious areas on the surface, all with the criterion of draining as much as possible efficient and fast as possible in the urbanized area. This dynamic affects the hydrology of the basin and especially the downstream areas. Upstream urbanization modifies the hydrograph that these areas receive, in such a way that the volume of runoff and the maximum flow increase (Figure 13).

Fig 11. Flood susceptibility Distribution table.
V. CONCLUSION
AHP has gained wide application in site selection, suitability analysis, regional planning, and landslide susceptibility analysis. To apply this approach, it is necessary to divide a complex unstructured problem into its component factors, organize these factors in a hierarchy of order, assign numerical values to subjective judgments about the relative importance of each factor, and synthesize these judgments to determine the factors priorities be assigned to these factors (Saaty& Vargas, 2001).
Comprehensive flood risk and vulnerability analysis require detailed information on field conditions, hydrological statistics, and characteristics of flood defense structures for analysis and results can indicate the extent and severity of flood impact in specific areas.
This research presents an empirical approach to map flood susceptibility in urban and rural areas by integrating AHP and GIS techniques. The proposed approach can help decision-making and policymakers responsible for the rapid assessment and evaluation of the flood phenomenon in urban municipalities. To take action against the damage caused by floods, it is essential to take protective actions. These can be of two types: structural measures (construction of works), or non-structural measures (indirect or institutional). The objective of the structural measures is to avoid or mitigate the damage caused by a flood, through the construction of works (usually carried out by government agencies, since heavy investments are required).
For example, to protect an urban area crossed by a river, it is possible to propose as structural measures the retention, storage, and diversion of water, make modifications to the channel (channel it or pipe it), build banks or channeling walls and modify bridges or culverts. On the other hand, among the non-structural measures are those whose purpose is to timely inform riverside populations of the occurrence of a possible flood, so that there are no deaths and damage is minimized.
This item includes land use regulations, alerting and social communication and dissemination programs, or the creation and implementation of an infrastructure construction program for flood control and flood protection according to comprehensive planning of basins. From the economic point of view, both structural and non-structural measures have application in areas that are already developed; while in underdeveloped areas the latter often have the same or greater impact than the structural ones.
For the study area, a flood risk map has been derived using a multi-criteria approach that combines geological, geohydrological, and edaphological factors, among others, measured in terms of variables according to the AHP methodology. Validation of the flood map using comparative area and depth measurements shows that the proposed approach is reliable with up to a 92% level of precision for decision-making for flood management planning. In addition, a coherence index of less than 0.10 was determined from the trial process. This further validates the reliability of the approach and the proposed results.
The results of this study confirm that the integration of AHP and GIS techniques provides a powerful tool for decision-making procedures in flood hazard mapping, as it allows consistent and efficient use of spatial data. The use of multi-criteria evaluation for different factors has also proven useful in defining risk areas for flood mapping and their possible prediction. Overall, the case study results show that the GIS-AHP-based category model is effective in flood risk zoning.
VI. ACKNOWLEDGEMENTS
My thanks to all the people who supported in the preparation of this publication and with this new knowledge of prevention of natural risks is provided.
REFERENCES
[1] Aranda–Gómez, J.J., Pérez–Venzor, J.A., 1988, Estudio Geológico de Punta Coyotes, Baja California Sur: Universidad Nacional Autónoma de México, Revista Del Instituto de Geología 7, 1–21.
[2] Aranda–Gómez, J.J., Pérez–Venzor, J.A., 1989a, Estratigrafía del Complejo Cristalino de la región de Todos Santos, Estado de Baja California Sur: Revista del Instituto de Geología, Universidad Nacional Autónoma de México, 8(2), 149–170.
[3] Ayalew L, Yamagishi H, 2005a, The application of GIS-based logistic regression for landslide susceptibility mapping in the Kakuda-Yahiko Mountains, Central Japan. Geomorphology. 65:15–31.
[4] Bates, P. D., M. D. Wilson, M. S. Horritt, D. C. Mason, N. Holden, and A. Currie,2006, Reach scale floodplain inundation dynamics observed using airborne synthetic aperture radar imagery: Data analysis and modeling, J. Hydrol., 328, 306–318, doi:10.1016/j.jhydrol.2005.12.028.
[5] Barker, D.M, Lawler, D.M. Knight, D.W., Morris, D.G., Davies, H.N., Stewart, E.J, 2009, longitudinal distributions of river flood power: the combined automated flood, elevation and stream power (CAFES) methodology. Earth Surface Processes and Landforms 34, 280–290.
[6] Becker, J. S., K. C. Wright, B. J. Doody, and D. Webber, 2010, Perceptions of flooding in four Australian communities: Results of focus groups with residents. GNS Science Rep., 37 pp.
[7] Benito G. etal. 2010, Management of alluvial aquifers in two southern African ephemeral rivers: implications for IWRM. Water Resources Management, 24, 641–667.
[8] Bathrellos G.D., Gaki-Papanastassiou K., Skilodimou H.D., Papanastassiou D., Chousianitis K.G, 2012, Potential suitability for urban planning and industry development by using natural hazard maps and geological – geomorphological parameters. Environ. Earth Sci.66 (2):537–548.
[9] Botzen, W. and van den Bergh, J, 2012, monetary valuation of insurance against climate change risk’, International Economic Review 53 (3): 1005–1026.
[10] Cavazos T, Hastenrath S, 1990, Convection and rainfall over Mexico and their modulation by the Southern Oscillation. Int J Climatol 10(4):377 386. doi:10.1002/joc.3370100405.
[11] Centro Nacional de Prevención de Desastres. Impacto Socioeconómico de los Desastres en México Durante, 2016, México, DF: Centro Nacional de Prevención de Desastres; 2016. Disponible en: http:// www.cen apred.gob.mx/es/Publicaciones/archivos/340-NO.17-Resumenejecutivoimpacto2015.
[12] Chen, Y., Fingleton, B., Pryce, G., Chen, A.S., and Djordjević, S., 2013, Implications of rising flood-risk for employment location: a GMM spatial model with agglomeration and endogenous house price effects. Journal of Property Research, (In press)
[13] Cloke, H., Pappenberger, F., 2008, evaluating forecasts of extreme events for hydrological applications: an approach for screening unfamiliar performance measures. Meteorological Applications 15, 181–197.
[14] CNA (Comisión Nacional del Agua) ,2002, Determinación de la disponibilidad de agua en el acuífero de La Paz, Estado de Baja California Sur. Dirección General Técnica. Gerencia de Aguas Subterráneas. Subgerencia de Evaluación y Modelación Hidrogeológica. 18 pp
[15] Cruz-Falcón A, 2007, Caracterización y Diagnóstico del Acuífero de La Paz B.C.S. Mediante Estudios Geofísicos y Geohidrológicos. Tesis de Doctorado, IPN-CICIMAR, Diciembre de 2007. 139 pp
[16] Cruz-Falcón A., Vázquez-González R., Ramírez Hernández J., Nava-Sánchez E.H., Troyo-Diéguez E., Rivera-Rosas J. y Vega-Mayagoitia J.E., 2011, Precipitación y Recarga en la Cuenca de La Paz, BCS, México. Revista Universidad y Ciencia, 27 (3): 251-263.
[17] Dai, F. C., & Lee, C. F.,2002, Landslide characteristics and slope instability modeling using GIS, Lantau Island, Hong Kong. Geomorphology, 42, 213– 228.
[18] DasS, 2018, Geographic information system and AHP-based flood hazard zonation of Vaitarna basin, Maharashtra, India. Arab J Geosci. 11(19):576.
[19] Das S, Pardeshi SD, 2018b, Morphometric analysis of Vaitarna and Ulhas river basins, Maharashtra, India: using geospatial techniques. Appl Water Sci 8(6):158. https://doi.org/10.1007/s13201-018-0801-z
[20] Dahri N, Abida H (2017) Monte Carlo simulation-aided analytical hierarchy process (AHP) for flood susceptibility mapping in Gabes Basin (southeastern Tunisia). Environ Earth Sci 76(7):302
[21] Degiorgis, Massimiliano, Gnecco, Giorgio, Gorni, Silvia, Roth, Giorgio, Sanguineti, Marcello, Celeste Taramasso, Angela, 2012. Classifiers for the detection of floodprone areas using remote sensed elevation data. J. Hydrol. 470–471, 302–315. http://dx.doi.o rg/10.1016/j.jhydrol.2012.09.006 (ISSN 00221694).
[22] Delgadillo, A. & Páez, G, 2008, Aspectos hidrológicos, subcuencas susceptibles a crecidas, escenarios de riesgo. En C. Ferrer & M. Duarte (Eds.). (2008). Plan de desarrollo urbano Del Municipio Antonio Pinto Salinas, bajo el enfoque de gestión del riesgo. Caracterización del riesgo de la Cuenca del valle Mocoties. Mérida: FUNDAPRIS
[23] Dobler C, Pappenberger F, 2013, Global sensitivity analysis for a complex hydrological model applied in an Alpine watershed. HydrolProc 27(26):3922–3940
[24] DoocyS, DanielsA, PackerC, DickA, KirschTD,2013, The human impact of earthquakes: a historical review of events 1980-2009 and systematic literature review. PLoS Currents. 5: 1–9.
[25] El Marjani, Z.E.A., Ebener, S., Boos, J., Abdel Ghaffar, E. and Musani, A. 2007, “Modelling the spatial distribution of five hazards in the context of the WHO/EMRO Atlas of disaster risk as a step towards the reduction of the health impact related to disasters”, International Journal of Health Geographics, Vol. 6 No. 8 p. 1-28
[26] Elkhrachy, I. Flash flood, 2015d, hazard mapping using satellite images and GIS tools: a case study of Najran city, The Kingdom of Saudi Arabia (KSA).Egypt J Remote Sens Space Sci.
[27] Fischer S, Schumann A, Schulte M., 2016, Characterisation of seasonal flood types according to timescales in mixed probability distributions. Jhydrol 539:38–56.
[28] Fernández D. & Lutz M, 2010, urban flood hazard zoning in Tucumán Province, Argentina, using GIS and multicriteria decision analysis. Engineering Geology Vol. 111 1–4, 90-98.
[29] Fuentes Junco, J. J. A, 2004, Análisis morfométrico de cuencas: caso de estudio del Parque Nacional Pico de Tancítaro.México: Dirección General de Investigación de Ordenamiento Ecológico y Conservación de Ecosistemas.Instituto Nacional de Ecología (INE).
[30] Fuller IC, 2008, geomorphic impacts of a 100-year flood: Kiwitea stream, Manawatu catchment, New Zealand. Geomorphology 98:84–95
[31] Farfa´n LM, Fogel I, 2007, Influence of tropical cyclones on humidity patterns over southern Baja California Mexico. Monthly Weather Review 135(4):1208 1224
[32] Fekete, A., Damm, M., and Birkmann, J, 2009, Scales as a challenge for vulnerability assessment, Natural Hazards, in review.
[33] Fernandez, D. S., & Lutz, M. A,2010,Urban flood hazard zoning in Tucumán Province, Argentina, using GIS and multicriteria decision analysis. Engineering Geology, 111(1-4), 90-98. DOI: 10.1016/j.e ngge o.2009.12.006
[34] Fuentes Junco, J. J. A, 2004, Análisismorfométrico de cuencas: caso de estudio Del Parque Nacional Pico de Tancítaro. México: Dirección General de Investigación de Ordenamiento Ecológico y Conservación de Ecosistemas.Instituto Nacional de Ecología (INE).
[35] Gupta, R.P., Saha, A.K., Arora, M.K. and Kumar, A., 1999, Landslide hazard zonation in a part of Bhagirathy Valley, Garhwal Himalayas, using integrated Remote Sensing GIS. Journal of Himalayan Geology, 20 (2), 71-85.
[36] Guzzetti, F., Carrara, A., Cardinali, M., and Reichenbach, P, 1999, Landslide hazard evaluation: a review of current techniques and their
[37] Application in a multi-scale study, Central Italy, Geomorphology,31, 181–216.
[38] Haeffner, M, K Galvin and A Váquez, 2016, “Urban water development in La Paz, Mexico 1960- present: a hydrological perspective.” 9, 2:169-187 Water History doi: 10.1007/s12685-016-0180-z 2015 RG Journal impact: 0.59
[39] Haoyuan Hong, Mahdi Panahi, AtaollahShirzadi, Tianwu Ma, Junzhi Liu, A-Xing Zhu, Wei Chen, Ioannis Kougias, Nerantzis Kazakis, Flood susceptibility assessment in Hengfeng area coupling adaptive neuro-fuzzy inference system with genetic algorithm and differential evolution,Science of The Total Environment, Volume 621, 2018, Pages 1124-1141, ISSN 0048-9697.
[40] Horton, R., 1945, Erosional Development of Streams and Their Drainage Basins: Hydrological Approach to Quantitative Morphology. Geological Society of America Bulletin, 56, 275-370. https://do i.org/ 10.1 130/0016-7606 (1945) 56 [275:EDOSAT] 2.0.CO;2
[41] Hirales-Rochin, J., Urcadiz-Cazares, F. J., 2018, Geo-hazards associated with the urban geology of the city of La Paz, B.C.S., México (northwest portion). AEG News, vol. 61, no. 4, pp. 32-37.September 15-23, 2018.San Francisco, California.
[42] Hirales-Rochin, J., Urcadiz-Cazares, F. J.,2019, Geo-hazards associated with urban geology in the City of La Paz Baja California Sur., Mexico: AEG News, vol. 62, no. 3, pp. 32-37.
[43] Hirales-Rochin, J.,2020, Risk Susceptibility Mapping Based on the Urban Geology of the City of La Paz, B.C.S., Mexico(NE-SE portion):AEG News,vol.63 no.3,pp.29-35
[44] Horton, R. E., 1932, Drainage-basin characteristics. Transactions, 13(1), 350 – 361.
[45] Horton, R. E., 1945, Erosional development of streams and their drainage basins: hydrophysical approach to quantitative morphology. Bulletin of the Geological Society of America. (56), 275 – 370.
[46] Hudson PF, Kessel RH., 2000, Channel migration and meander-bend curvature in the lower Mississippi River, before major human modification. Geology 28:531–553.
[47] INEGI. 2015, Resultados de la encuesta nacional de ocupación y empleo. Instituto Nacional de Estadística y Geografía. Consultado el 28 de Enero del 2015. Disponibleen http://www.inegi.org.mx.
[48] Kazakis, Nerantzis, Voudouris, Konstantinos S., 2015, Groundwater vulnerability and pollution risk assessment of porous aquifers to nitrate: modifying the drastic method using quantitative parameters. J. Hydrol. 525, 13–25.
[49] Kappes M, Papathoma-Ko¨hle M, Keller M., 2011, assessing physical vulnerability for multi-hazards using an indicator-based methodology. ApplGeogr 32:577–590.
[50] Karaman H, Erden T., 2014, Net earthquake hazard and elements at risk (NEaR) map creation for city of Istanbul via spatial multi-criteria decision analysis. Natural Hazards:1-25 doi:10.1007/s11069-0141099-2
[51] Karaman H. 7th International Conference on Natural Hazards (NAHA ’15) 40, 2015, Integrated multi-hazard map creation by using AHP and GIS; pp.101–110.
[52] Knighton, A.D., 1999. Downstream variation in stream power. Geomorphology, 29, 293-306.
[53] Köplin N, Addor N, Rössler O, Huss M, Weingartner R, Seibert J.,2014,Robust changes and sources of uncertainty in the projected hydrological regimes of Swiss catchments. Water Resour Res 50(10):7541–7562.
[54] Kumar R, Chatterjee C., 2011, Development of regional flood frequency relationships for gauged and ungauged catchments using L-moments. In: Kropp JP, Schellnhuber HJ (eds) Extremis – disruptive events and trends in climate and hydrology. Springer Heidelberg Dordrecht London, New York, pp 105–127.
[55] Kundzewicz ZW (2002) Non-structural flood protection and sustainability. Water Int 27(1):3–13.
[56] Li, X., Tan, H., Li, S., Liu A., Yang T., Wen S., et al., 2007, Years of potential life lost in residents affected by floods in Hunan, China. Trans R Soc Trop Med Hyg. 101, 299-304.
[57] Marinoni, O., 2004, Implementation of the analytical hierarchy process with VBA in ArcGIS. Comput. Geosci. 30, 637–646. doi:10.1016/j.cageo.2004.03 .010
[58] Mojaddadi, H. et al., 2017, Ensemble machine-learning-based geospatial approach for flood risk assessment using multi-sensor remote-sensing data and GIS. Geomatics, Natural Hazards, and Risk,8(2), 1080–1102.https://doi.org/10.1080/19475705.201 7.1 2 94113
[59] Moore ID, Grayson RB, Ladson AR., 1991, Digital terrain modeling: a review of hydrological, geomorphological and biological applications. Hydrol Pro 5:3–30
[60] Monzalvo, M., 2010, Simulación hidrodinámica del acuífero de La Paz y su aprovechamiento como fuente de desalación. MScThesis, Universidad Nacional Autónoma de México.
[61] Moore, I.D., R.B. Grayson, and A.R. Ladson., 1991, Digital terrainmodeling: a review of hydrological, geomorphological and biologicalapplications. Hydrol. Process. 5, 3-30. Doi: 10.1002/ hyp.3360050103.
[62] Nikoo, M, Ramezani, F., Hadzima-Nyarko, M., Nyarko, E.K., Nikoo M., 2016, Flood-routing modeling with neural network optimized by social-based algorithm Nat. Haz., 82 (1) pp. 1-24.
[63] Ortega-Gutiérrez, F., Mitre-Salazar, L. M., Roldán-Quintana J., Aranda-Gómez, J.J., Morán-Zenteno D., Alaniz-Alvarez, S. A., y Nieto- Samaniego, A. F., 1992, Texto explicativo de la Carta Geológica de la República Mexicana 5a. Ed. Universidad Nacional Autónoma de México, Instituto de Geología; y Secretaria de Energía-Minas e Industria Paraestatal, Consejo de Recursos Minerales. Mapa con texto explicativo, escala 1: 2 000,000, 74 pp.
[64] Oropeza Orozco, O.,2004, “Evaluación de la vulnerabilidad a la desertificación”, en Martínez, J., A. Fernández Bremauntz y P. Osnaya (comps.), Cambio climático: una visión desde México, SEMARNAT–INE, pp. 303–314.
[65] Patra S, Mishra P, Mahapatra SC (2018) Delineation of groundwater potential zone for sustainable development: A case study from Ganga Alluvial Plain covering Hooghly district of India using remote sensing, geographic information system and analytic hierarchy process. J CleanProd 172:2485–2502.
[66] Pérez-Venzor, J.A., 2013, Estudio Geológico-Geoquímico del borde oriental del bloque Los Cabos Baja California Sur, México, Universidad Nacional Autónoma de México (UNAM) Tesis de doctorado, 294 pp.
[67] Panagopoulos GP, Bathrellos GD, Skilodimou HD, Martsouka FA., 2012, mapping urban water demands using multi-criteria analysis and GIS. Water Res Manag 26(5):1347–1363.
[68] Papaioannou G, Loukas A, Vasiliades L, Aronica GT., 2011,Flood prone areas mapping through GIS and multi-criteria analysis, EGU Leonardo Conference, Bratislava, Slovakia. Papaioannou G, Loukas A, GeorgiadisCh (2013) The effect of riverine terrain spatial resolution on flood modeling and mapping, Proc. SPIE 8795, First International Conference on Remote Sensing and Geoinformation of the Environment (RSCy2013), 87951H; doi:10.1117/12.2028218
[69] Papadopoulou-Vrynioti K, Alexakis D, Bathrellos GD, Skilodimou HD, Vryniotis D, Vasiliades E, Gamvroula D., 2013b,Distribution of trace elements in stream sediments of Arta plain (western,Hellas): the influence of geomorphological parameters.J Geochem Explor 134:17–26
[70] Peng S.H., Shieh M.J., Fan S.Y., 2012, Potential hazard map for disaster prevention using GIS-based linear combination approach and analytic hierarchy method. J. Geogr. Inf. Syst.4:403–411.
[71] Pilling CG, Jones JAA., 2002, The impact of future climate change on seasonal discharge, hydrological processes and extreme flows in the Upper Wye experimental catchment Mid-Wales. Hydrol Process 16(6):1201–1213
[72] Pradhan B., 2009, Groundwater potential zonation for basaltic watersheds using satellite remote sensing data and GIS techniques. Central Eur J Geosci 1(1):120–129. Doi: 10.2478/v10085-009-0008-5.
[73] Rajaguru, S.N., Gupta, A., Kale, V.S., Ganjoo, R., Ely, L., Enzel, Y. and Baker, V.R., 1995, Channel form and processes of the flood-dominated Narmada River, India. Earth Surf. Process. Landforms, 20: 407-42 I.
[74] Rahmati O, Zeinivand H, Besharat M., 2016a,Flood hazard zoning in Yasooj region, Iran, using GIS and multi-criteria decision analysis. Geomat Nat Hazard Risk.https://doi.org/10.1080/19475705.2015.104504.
[75] Rahmati O, Pourghasemi HR, Zeinivand H., 2016b,Flood susceptibility mapping using frequency ratio and weights-of-evidence models in the Golastan Province, Iran. Geocarto International. https://d oi.org/10.1080/10106049.2015.1041559.
[76] Reneau, S. L., 2000, Stream incision and terrace development in Frijoles Canyon, Bandelier National Monument, New Mexico, and the influence of lithology and climate. Geomorphology 32, 171-193.
[77] Romero-Vadillo, I. y Romero-Vadillo, E., 2014, Fenómenos hidrometerológicos Como factor de incremento de la marginación. En Memorias en extenso Del 2° Congreso Internacional de la Red del Medio Ambiente. Instituto Politécnico Nacional, México.
[78] Rozos D, Bathrellos GD, Skilodimou HD., 2011, Comparison of the implementation of rock engineering system (RES) and analytic hierarchy process (AHP) methods, based on landslide susceptibility maps, compiled in GIS environment. A case study from the Eastern Achaia County of Peloponnesus, Greece. Environ. Earth Sci 63(1):49–63.
[79] Rozalis S, Morin E, Yair Y, Price C.,2010,Flash flood prediction using an uncalibrated hydrological model and radar rainfall data in a Mediterranean watershed under changing hydrological conditions. J Hydrol. 394:245–255
[80] Thapa, R. B. and Murayama, Y., 2011, Urban growth modeling of Kathmandu metropolitan region, Nepal. Computers, Environment, and Urban Systems. 35(1):25-34
[81] TermehSVR, KornejadyA, PourghasemiHR, Keesstra,S., 2018,Flood susceptibility mapping using novel ensembles of adaptive neuro-fuzzy inference system and metaheuristic algorithms. Sci Total Environ. 615:438–451
[82] Tehrany MS, Pradhan B, Jebur M.N., 2014, Flood susceptibility mapping using a novel ensemble weights-of-evidence and support vector machine models in GIS. J Hydrol 512:332–343. doi:10.10 16/j.jhydrol.2014.03.008
[83] Tehrany MS, Pradhan B, Jebu MN.,2013a, A comparative assessment between object and pixel-based classification approaches for land use/land cover mapping using SPOT 5 imagery. GeocartoInt 2:1–19. doi:10.1080/10106049.2013.768300
[84] Xu, F.L., Tao, S., Dawson, R.W., Li, P.G., Cao, J., 2001, VLake ecosystem health assessment: indicators and methods. Water Res. 35, 3157–3167.
[85] Saaty, Thomas L., 1980, The analytic hierarchy process: Planning, priority setting, resource allocation. New York: McGraw-Hill. ISBN: 0070543712.
[86] Saaty, Thomas L., 1990a. How to make a decision: the analytic hierarchy process (ISSN 03772217)
[87] Saaty, T. L., Vargas L. G., 2001, Models, Methods, Concepts & Applications of the Analytic Hierarchy Process. ISBN 0-7923-7267-0, Kluwer Academic.
[88] Saaty, T. L., 2004, Fundamentals of the analytic network process – dependence and feedback in decision-making with a single network’, Journal of Systems Science and Systems Engineering, 13(2), pp. 129–157. DOI: 10.1007/s11518-006- 0158-y
[89] Singh, SK, Pandey, AC, Nathawat, MS. 2011, Rainfall variability and spatiotemporal dynamics of flood inundation during the 2008 Kosi flood in Bihar State. Asian J Earth Sci. 4(1):9–19.
[90] Singh R, Arya DS, Taxak AK, Vojinovic Z., 2016, Potential impact of climate change on rainfall intensity-duration-frequency curves in Roorkee, India. Water ResourManag 30:4603–4616.
[91] Smith J A, Villarini G and Baeck M L., 2011, Mixture distributions and the climatology of extreme rainfall and flooding in the eastern US J. Hydrometeorol. 12 294–309.
[92] Soulsby, C., C. Birkel, J. Geris, J. Dick, C. Tunaley, and D. Tetzlaff., 2015, Stream water age distributions controlled by storage dynamics and nonlinear hydrologic connectivity: Modeling with high‐ resolution isotope data, Water Resour. Res., 51, 7759– 7776, doi: 10.1002/2015WR017888.
[93] Torres-Martinez, J.A., Mora, A., Ramos-Leal, J.A., et al.,2019,Constraining a density-dependent flow model with the transient electromagnetic method in a coastal aquifer in Mexico to assess seawater intrusion. Hydrogeol J 27, 2955–2972 https://doi.org/10.1007/s 10040-019-02024-w.
[94] Van Westen CJ, Castellanos Abella EA, Sekhar LK., 2008, spatial data for landslide susceptibility, hazards and vulnerability assessment: an overview. EngGeol 102 (3–4):112–131.
[95] Wanders, N., Karssenberg, D., Bierkens, M., Parinussa, R.,de Jeu, R., van Dam, J., and de Jong, S.,2012, Observation uncertainty of satellite soil moisture products determined with physically-based modeling, Remote Sens. Environ., 127, 341–356, doi:10.1016/j.rse..09.004, 2012.
[96] Wohl, E.E., 1992, Bedrock benches and boulder bars: Floods in the Burdekin Gorge of Australia. Geol. Sot. Am. Bull., 104: 770-778.
[97] Youssef AM, Pradhan B, Gaber AFD, Buchroithner MF., 2009, Geomorphological hazard analysis along the Egyptian Red Sea Coast between Safaga and Quseir. Nat Hazards Earth Sys Science 9:751–766.
[98] Zhang, Y., J. A. Smith, and M. L. Baeck.,2001, The hydrology and hydrometeorology of extreme floods in the Great Plains of eastern Nebraska, Adv. Water Resour., 24(9–10), 1037– 1050.