
Abstract– Geology as a tool to identify areas of geological risk is useful to determine the close relationship between the geological space and the sustainable urban development of a city. At the national, regional and local level where the study area is located, there is a growing need to create new urban areas, but these are not linked to an adequate analysis of the geological environment and the knowledge of the main factors that control risk conditions. The methodology was based on a characterization of the geological, hydrogeological and geomechanical conditions of one of the main urban settlements of the city of La Paz, capital of the state of Baja California Sur., Mexico. Therefore, using the Analytic Hierarchy Process (AHP) methodology it was generated a risk susceptibility map-related in local areas to flood events and landslides. The results represent the first stage of a larger-scale project and with this; it is possible to contribute new knowledge to be used in the most precise zoning of geographic risks, which will allow the state capital a sustainable growth of the population of the city. The improvement of current construction standards and the corresponding zoning to anticipate their development in an orderly manner. Finally, it is considered that this research´s type (urban settlement scale) provides an analysis of the risk conditions where the citizen can locate in their community and know their conditions of civil protection, all the opposite of most risk studies that offer large-scale results and only offer a broader view.
Keywords– Geological risks; sustainable urban development; zoning; Analytic Hierarchy Process (AHP).
1. INTRODUCTION
The natural hazards that occur on our planet are always linked to its own geodynamics, which comprises geological and hydrogeological processes. Within this interaction of processes are the constant and intense effects on humans in them physical-urban environment. Therefore, it is of utmost importance to know and apply this type of knowledge to urban risk management in the zoning of susceptible areas to risk and urban development planning and through a methodology that provides an uncertainty analysis showing the spatial distribution of the most suitable and ideal areas for urban development in urban and suburban areas (Bathrellos et al,.2017).
In 2008, states the United Nations Development Program (UNDP) for the first time in history, half of the world’s population, about 3.3 billion people, lived in urban areas. Today, one-third of the world’s urban population – 1 billion people – currently live in settlements precarious.
The unplanned expansion that many cities have undergone to cope with sudden population growth combined with inadequate territorial planning and the failure of urban authorities to regulate building regulations are just a few of the factors that contribute to increasing the vulnerability of urban populations. Furthermore, poor living conditions in terms of health, nutrition, poverty, illiteracy or sanitation, pose a permanent threat to the physical and psychological security of these population groups and generate “daily risks” that generate continuous small-scale disasters. Risks of extreme natural hazard disasters are seen aggravated by these daily risks, giving rise to a process of “risk accumulation” characteristic of urban areas, where human activities intensify the risk. Therefore, urbanization frequently increases the exposure of people and goods face threats and create new patterns of risk, making disaster management in urban areas especially complex.
In recent years, in Mexico, the search for this “empathy” between the environment and the human being has come to shape disciplines such as Urban Geology that aims to form a planned and sustainable relationship of urban development.
Mexico is a highly urbanized country with nearly 80 percent of its population living in urban areas. Between 1970 and 2000, the surface area of Mexico City grew 1.5 times faster than its population. With high rates of uninhabited housing and the segregated development of housing projects stemming from severe income disparities, Mexico City is faced with massive urban sprawl, as are many other cities in Mexico.
Therefore, the interactions of the physical environment (factors: the climate, topography, geology, and the mechanical resistance of the rock) (Geological Resistance Index-IGR) (Hoek et al., 1994) play a very important role as trigger mechanisms of landslide processes and their different variants. To increase the knowledge of this type of process, it is necessary to consider these relationships in the triggering processes, which form a planning tool for current urban development. The notions of danger vulnerability (susceptibility) and geological risk can establish a close relationship between changes in the geological environment and urban development.
Geological, hydrogeological and meteorological risks are currently responsible for the high rates of damage and destruction in urban areas, in the 20th century alone it is estimated that more than a million people worldwide have died because of earthquakes. In Latin America, these earth movements are constant and cause landslides and rocks as a side effect.
In this geological context, Mexico is located in the Ring of Fire, on the tectonic plates of the Pacific, Cocos, North America, and the Caribbean. Tectonic activity in this area is high, with an incidence of 80% in seismic and volcanic activity compared to global activity. Besides, the country is located within four of the six global cyclone-generating hydro-meteorological regions, which influence different areas of the territory of Mexico. In total, this geo-climatological location places 17 Mexican entities in areas of vulnerability and danger, where almost half of the Mexican population (60 million inhabitants) lives., Where phenomena such as hurricanes, floods, droughts, frost, and hailstorms stand out., (Oropeza, 2008). Baja California Sur (BCS) is the entity with an incidence of an average tropical cyclone in the Northeast Pacific and two approaches less than 300 km. Between 1966 and 2010, 39 cyclones hit the entity, 20 of which arrived in September (Vadillo, 2010). Also, considering that the runoff volume (11 Mm3 / year, a product of a precipitated volume of 351 Mm3 / year) by the streams that make up a large part of the urban area of the city of La Paz (Mireles-Monzalvo, 2010).
Therefore, the geological, hydrogeological and meteorological conditions of the environment that make up the city of La Paz, Baja California Sur, Mexico are determining factors in its urban geology, since these elements play an important role in potential risks (floods and landslides) in urban and suburban areas. Therefore, it is observed that a more timely geological recognition is required, this is on a scale (urban settlement) where the possible geological risks and the risks derived from geological and hydrometeorological events are characterized and identified. Mitigation of landslide disasters can be successful only when detailed knowledge is obtained about the expected frequency, character, and magnitude of the landslide in the area. The zonation of landslide hazards may be the basis for any landslide disaster mitigation work and can supply planners and decision-makers with adequate and understandable information. Landslide hazard analysis is a complex task. It requires a large number of input parameters and techniques for analysis. The process involves both cost and time (Tianchi,1996).
At the national, regional and local level where the study area is located, there is an increasing need to create new urban areas, but these are not linked to an adequate analysis of the geological environment and knowledge of the main factors that control risk conditions and consequently, its impacts have been manifested due to different factors, such as:
- Global climate change,
- Inadequate land use,
- Lack of knowledge of the geological environment, and uncontrolled urban-population growth.
It is considered that the geological characteristics of the Southern Region of the Baja California Peninsula, where the city of La Paz is located, have been described in various research works by various authors and institutions at the level of regional and local geology (Mina, 1957) (Ortega-Gutiérrez, 1982), (Aranda-Gómez and Pérez-Venzor, 1988a, 1989b) (Schaff et. al, 2000), and more recently the work carried out by Pérez-Venzor, 2013 makes a geological-geochemical study from the southern portion of the State (Los Cabos Block) where it refers to this study area as part of a Plutonic Complex of the Geological Province of La Paz.
All of the above antecedents focus on different geological knowledge objectives, but there is little regional and local research that includes urban geology directed to geological engineering and geotechnical purposes, this material is little known; as in Guaymas, Sonora (Vega et al., 2004) where he characterized the area based on local geology in various aspects and developed several thematic maps; On the other hand, in the city of Tijuana, Baja California, a diagnosis of urban risks were made (López, 2002) where a geological characterization of the city was carried out.
Within Baja California Sur, urban geology has focused on isolated works consisting of the identification of geological danger zones in the southern part, in the Cabo San Lucas area (Rojas-Álvarez, 2007) and recently in 2012; the natural risk atlas was developed at the state level. The work scale could be chosen based on three factors, such as the purpose of assessment, the extent of the studied areas, and data availability (Aleotti and Chowdhury, 1999). The landslide analysis can be grouped in the input map scale: detailed scale (1:5000), large scale (1:5000–1:10 000), medium-scale (1:25 000– 1:50 000) and regional scale (1:250 000) (Luzi and Pergalani, 1996).
Therefore, it is observed that a more opportune geological survey is required, this on a scale (urban settlement) where the possible geological risks and the risks derived from geological and hydrometeorological events are characterized and identified.
Most of the recent literature and research have focused their methodology of vulnerability and susceptibility studies of geological, geohydrological and meteorological risks on the impacts of individual risks, such as landslides (Althuwaynee et al. 2014; Pellicani et al. 2017), floods (Kazakis et al. 2015; Kabenge et al. 2017), earthquakes (Theilen-Willige 2010;Dhar et al. 2017), drought (Lehner et al. 2006), sea-level rise (Hinkel et al. 2014), tropical cyclones (Hoque et al. 2018) or forest fires (Adab et al. 2013). However, in reality, many places are prone to multiple natural hazards that can occur simultaneously or manifest in a cascading set of events (Kappes et al. 2012). Mitigating and planning for complex outcomes require consideration of combined hazard risk.
Multiple-risk assessment methods can be classified into two approaches: (a) independently assessing individual risks in a particular geographic location (Greiving et al. 2006; Grunthal et al. 2006; Carpignano et al. 2009; Schmidt et al. 2011); and (b) evaluate possible interactions and / or cascading effects between the different possible dangerous events (Nadim and Liu 2013; Garcia-Aristizabal et al. 2015; Zhang et al. 2016). Most studies acknowledge that risk interactions (i.e. triggering and/or cascading effects) are important considerations in assessing the risk of danger. However, very few studies have explicitly considered cascading effects and hazard interactions (Kappes et al. 2012; Marzocchi et al. 2012; Gill and Malamud 2014; Van Westen et al. 2014; Liu et al. 2015).
The methodology applied to this study considers the first approach focused on an integrated assessment of individual risks using the Analytical Hierarchy Process (AHP). The analytical hierarchy process (AHP) was developed at the Wharton School of Business by Thomas Saaty at the end of the 1970s. It is a decision-making tool for managing complex, unstructured, multi-criteria decisions. It provides a flexible and easily understandable way to analyze complicated problems and allows ideas related to landslides to be modified, and in turn allows for objective and subjective considerations to be incorporated into the decision process (Sharma, 1990), which is used to compare importance and weight of the factors that make up the physical environment of the study area and that together are measurable indicators of triggers such as climate, urban density, precipitation, topography, geology and the mechanical resistance of the rock (Geological resistance index -IGR) (Hoek et al. 1994), causing different geo-hazards, such as rockfalls, debris flows and or floods.
The main objective of the analysis and zoning of the susceptibility of geo-risks is to minimize their impact on the categorization of the most vulnerable areas within the study area, as well as on current and future urban developments in the city of La Paz, Mexico. All this will contribute to forming a culture of disaster prevention at a scale closer to citizens and their environment. The results will also impact government policies and construction regulations that lead to sustainable urban development in our city.
2. METHODS AND DATA
1.-Study zone
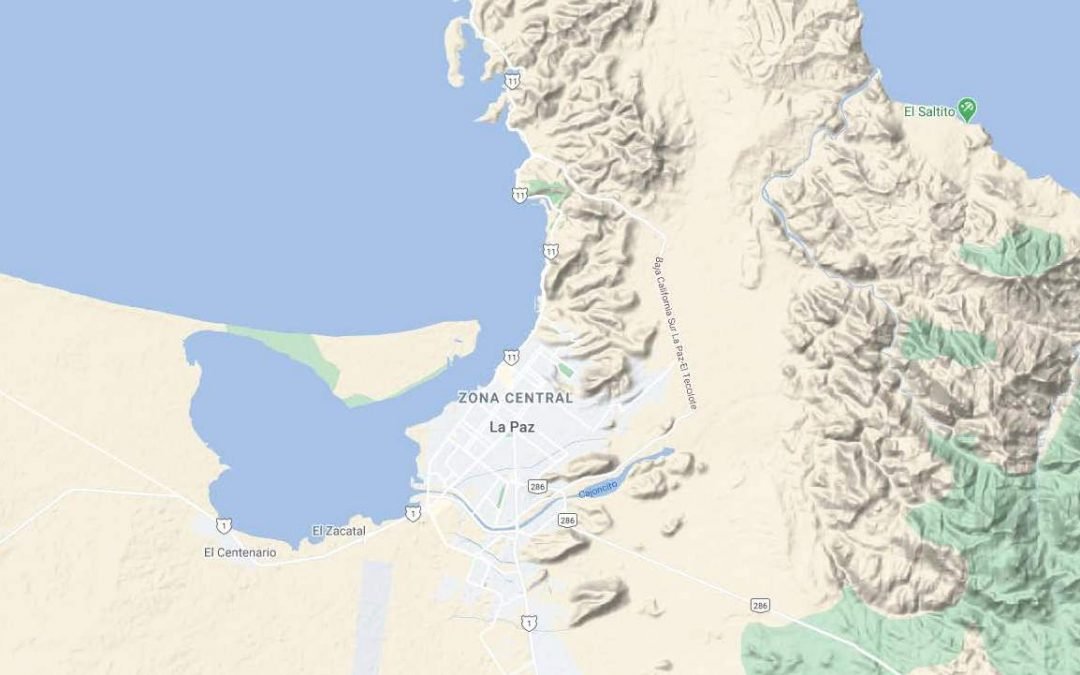
La Paz, the capital city of the state of Baja California Sur (BCS) and in turn head of the municipality of La Paz, which is located in the southern portion of the Peninsula of Baja California, Mexico (Figure 1); Within the Köppen classification, the dominant climates are very dry and very warm, with an average annual temperature ranging between 22°C and 24°C, with rains in summer and winter mainly, where winter precipitation is 10.2%. with great influence of atmospheric disturbances originated in the Pacific Ocean of cyclonic type, which produces very intense rainfall. The city of La Paz is characterized by a morphology dominated by basins and mountains, the result of the interaction of magmatic-tectonic processes, which is based on Holocene deposits that correspond to alluvial material (varying from sand to sandy gravel) of active streams, where the thickness of the material varies and can reach a few meters in the main streams (INEGI, 1995). Geologically in the area, volcanic and volcanoclastic rocks (sandstones and volcanoclastic conglomerates, rhyolitic tuffs, andesitic lahars, and lava flows) are represented by the Comondú Formation with an age between 30 and 12 Ma in the central portion (Aranda-Gómez y Pérez- Venzor, 1988, 1989a and Ortega-Gutiérrez et. al., 1992; Pérez-Venzor, 2013).
The total population of the city of La Paz is 251,871 inhabitants, of which 126,397 are men and 125,474 are women (INEGI, 2010).

Figure 1. Elevation map where the study area is located towards the NE portion of the city of La Paz, BCS., Mexico.
The area under study within this state capital is Marquez de León urban settlement, which is located in the northwestern portion of the city of La Paz, with a latitude of 24° 8´51´´ N and a longitude of 110° 16´10´´ W. Besides, it has an area of 806,840 m2.

Figure 2. Geologic map of study area located in the northwestern portion of the city of La Paz., Mexico.
2.-Lithology
The lithology is represented in a volcanic and vulcanosedimentary sequence, distributed in isolated outcrops within the area (Figure 2). Therefore, it is necessary to mention that there are no outcrops with stratigraphic continuity, or rock body, which can serve as an index horizon that suggests the position that a given unit occupies in the sequence, except for the “Riodacite Providencia” (Hausback, 1983). For example, the movement of lava or pyroclastic spills controlled by the contemporary drainage pattern to volcanism, combined with erosion effects.


Figure 3. A) Dominant lithology and structural aspects of the study area, B-C-D-E) Outcrops showing the dominant rocks, with some structural characteristics and particle size composition F) Stereographic projection of fractures and faults.
3.-Structural geology.
In the regional area that includes the Marquez de León urban settlement, it is possible to distinguish a series of alignments and irregularities in the drainage pattern and slope of the relief in the NS direction that is controlled by normal component faults, which have a scale of about 10 m. long with a dominant heading NE/NW or fractures in the form of diaclases that form patterns (Figure 3).
It is considered that in this region there may be a normal inclined fault towards which the base of the riodacitic spill emerges at heights greater than 200 m as in the Atravesado Hill, but that it is difficult to give continuity since there are many deposits of debris that cover the lower parts of the topography.
In an annexed way, families of structural data were analyzed where it was possible to distinguish a series of alignments and irregularities in the drainage pattern, a series of failures with a normal component that cuts the upper part of the lithological sequence was recognized.
Which have a scale of about 10 m. of length with the dominant course as possible failures or fractures (Figure 3) in the form of diaclases in a system of three main orientations. Considering this, they were grouped into three data sets (Faults: NE /NW, Fractures 1: SE/NW, Fractures 2: SE/NE) and they were represented on stereographic diagrams to select the areas of greatest susceptibility (Figure 3).
4.-Geological resistance index (GSI).
In most cases of rock removal processes, the resistance of the rock itself conditions the stability of the slopes, and the resistance to the discontinuity planes they present.
The Geological Strength Index (GSI), introduced by Hoek (1994), Hoek et al. (1995) and Hoek and Brown (1998) provides a system for estimating the reduction in rock mass strength for different geological conditions as identified by field observations. The rock mass characterization is straightforward and it is based upon the visual impression of the rock structure, in terms of blackness, and the surface condition of the discontinuities indicated by joint roughness and alteration (Table 1; from Hoek and Brown 1998). The combination of these two parameters provides a practical basis for describing a wide range of rock mass types, with diversified rock structures ranging from very tightly interlocked strong rock fragments to heavily crushed rock masses. Based on the rock mass description the value of GSI is estimated from the contours given in Figure 4-5.

Figures 4-5 Estimation of the Geological Resistance Index, (GRI), based on a Geological description of the Rock Massif (Hoek and Brown 1998., Marinos & Hoek, 2000).
Therefore, another complementary aspect was to calculate the susceptibility to planar landslides in rocks, (TOBIA kinematic method) (Santangelo et.al. 2015). This method relates to the structural features of the lithology (diaclases, fractures, faults, and stratifications) with the appearance and slope of the slope. In most cases of rock removal processes, the resistance of the rock itself conditions the stability of the slopes, and the resistance to the discontinuity planes they present. For this case study, outcrops present different lithology (heterogeneous and discontinuous medium), which assign a geomechanical behavior that can be evaluated based on the methodology developed by Hoek, et al. (1994) (1998), based on the identification, description, and classification of the mechanical characteristics of the structure based on two parameters: Fracture state and discontinuity surfaces (Quality of discontinuities), assigning values of geological resistance index (GSI) to each lithology recognized in the area (Figures 5- 6).
The GSI evaluation was performed by comparison with typical conditions, the value of the GSI varies between 0 and 100.
You can define five rock quality classes (Table 1):
- Very Poor Rock Quality (GSI 0 -20)
- Poor rock quality (GSI 20 – 40)
- Regular rock quality (GSI 40-60)
- Good rock Quality (GSI 60-80)
- Very Good rock Quality (GSI 80-100)
Table 1. Fracture status and discontinuity surfaces (Quality of discontinuities), of the study area assigning values of Geological Resistance Index (GRI).

Considering the zoning at the local level, the dominant lithology and geotechnical data for urban development, a complementary method should be applied to cartography and field geology that allows to evaluate the stability of the landslides and/or falls of rocks in a superficial way of the study area (Model called SHALSTAB in ArcGis environment) (Coast et. al., 2008) (Sarkar, et. al. 2016), caused as a trigger for precipitation. This method is developed using geo-mechanical data considering the conditions of the agreement that form the geology and /or edaphology of the study area (rock and soil) (Table 2).
Table 2.- Geo-mechanical parameters of the soil where: C, cohesion; W, unit weight; φ, friction angle; ρ, density; L.L., Liquid limit P.L., Plastic limit; P.I.., Plastic index; %. DEVP., Dry empty volume percentage; % EVP, empty volume percentage.

The model allows for evaluating different rain conditions or detonating events. In the case of the study area, and intensity of 184mm/year was used, with a return period of 10 years according to the IFP curve (Precipitation Frequency Index) (Cruz-Falcón et. al. 2011).
5.-Geological and geohydrological risks.
The urban settlement due to its physical characteristics is influenced by some phenomena with potential for affectation, which are described below:
5.1. Floods
Due to its climate, topography, type of soils and slopes, the Valley and city of La Paz characterizes its surface hydrology due to the lack of rivers or permanent surface flows. However, the extent of the basin is defined by intermittent streams originating in the Las Cruces range and the plain in which these runoffs are distributed until they flow into the Bay of La Paz, which are reactivated during the season of rainfall and hurricanes, constituting those important areas of flooding are generated in the area peripheral of the city of La Paz.
The Marquez de Leon urban settlement is located in the northwestern portion of the La Paz basin and it´s characterized by a stream that is crossed by the mainstream of about 15m. wide and with irregular margins, that reach about 3m high (Figure 4). The right margin by compacted sand and fixed by endemic vegetation with a height of 1.5 meters and a shallow slope of about 15°, while its right margin is constituted by fragmented rocks of large dimensions (4m long by 1.5 thick which is known as a protective work placed by the state government) and a maximum height of 2.5 m. (Figure 9). This stream has a slope of about 25°.

Figure 6. Image that highlights the deposit areas of sediments transported by the stream (Floodplains).A) and B) Areason the periphery of the colony where the limits of the stream channels are observed and that denote the proximity to the areas of flooding to the urbanized area C) and D) Images that refer to urban development invading the riverbed and its potential flood risk.
This aspect is significant in this town due to the proximity of the urban settlements to the creek, which varies from 20m to 80m apart, and without any civil protection work, that protects the new urban conditions of the urban settlement.
Due to these aforementioned characteristics, the importance of precipitation, geology, and its relation to meteorological events are pointed out. These three factors affect the sediment transport process.
The lithology present in the area of this urban colony and the accumulation of deposits of sandy sediments from the Las Cruces range are very significant, having as a reference that the widest and deepest channels are filled with water more quickly. From the images, it is observed that there are recent flood plains on the banks of the streams, which indicate the potential for transport and deposition of sediments that occur in this urban settlement (Figure 4).
6.-Landslide-concepts.
Slope processes are also called gravitational processes, mass movement, or removal processes, in a general sense, also known as landslides. The most accepted and applied classification of the processes of mass recognition at the international level is based on the movement mechanism, which is why, in general, these movements are divided into falls or falls (falls), overturns or collapses (collapses), landslides, lateral expansions (lateral diffusion), flows and complex movements.
The European Programme on Climatology offers a simple and complete classification that considers these aspects and Natural Hazards (EPOCH,1993), which, based on the classification by Varnes (1978) and Hutchinson (1988), draws a distinction between the type of movement and the materials involved. According to this classification, the different movements (landslides, overturns or collapses, landslides, lateral expansions, flows, and complex movements) are subdivided according to the formation materials, which can be rocks, rubble or rubble, and soil.
Removal processes in earthworks occur due to two fundamental causes, which are external and internal (Terzaghi, 1950; Selby, 1993). External causes are all those that cause an increase in stress or stresses, but not in the resistance of the materials, while internal causes are those that decrease the resistance of the materials without changing the stress or stresses. The most accepted and applied classification of mass removal processes at the international level is based on the mechanism of the movement, so in general, these movements are divided into falls or falls (falls), overturns or collapses (topples), slides, lateral spreading, flows, and complex movements.
A simple and complete classification that considers these aspects is that offered by the EPOCH program (1993), which, based on the classification by Varnes (1978) and Hutchinson (1988), elaborates a distinction between the type of movement and the materials involved (Figure 5). According to this classification, the different movements (landslides, overturns or collapses, landslides, lateral expansions, flows, and complex movements) are subdivided according to the forming materials, which can be rocks, debris or debris and soils (Alcantara-Ayala,2000) In this context the most widely accepted classification by Cruden and Varnes from 1996 is suggested to be used (Figure 5).
7. Types of movements
7.1. Falls
The landslides or falls are the movements in the free fall of different materials such as rocks, debris, or soil.This type of movement originates from the detachment of the material from an inclined surface, which can bounce, roll, slide, or flow downstream. The material considered does not include small particles, the result of weathering. These movements are defined based on the material involved, which is why they are generally classified as rockfalls, debris falls, and soil falls. The speed of these movements can be fast or extremely fast, except when the displaced mass undergoes undermining or incision, and the detachment or fall is preceded by slides or overturns that separate the displaced material from the intact mass (Cruden and Varnes, 1996). These movements occur on steep slopes; both natural and artificial (Figure 5).
7.2. Slides
Slides are downslope movements of a mass of soil, debris, or rock, which occurs on a recognizable brittle surface. Frequently, the formation of transverse cracks is the first sign of the occurrence of this type of movement, which is located in the area occupied by the main scarp. The rupture surface defines the type of slip, whereby curved, concave,or spoon-shaped surfaces are associated with rotational slides, semi-flat or wavy rupture surfaces with translational movements, and flat surfaces with flat glides. In rotational landslides, the blocks located at the top lean back, the main scarp is regularly vertical, the displaced mass accumulates down the slope and its internal deformation is of a very low degree. Later movements to the initial one, can cause the progressive backward movement of the crown. The speed and length of this type of movement are highly variable. Translational landslides are shallower than rotational landslides, and like planes, involve movement parallel to the surface, which is largely controlled by weak surfaces of the forming materials.
Based on the stages of the movement, the rotational landslides are classified as simple, multiple and successive, a classification that also applies to the resulting variants of the type of material (example: a rotational landslide of rock, debris, soil; and therefore, single, multiple, successive rock slide, etc.). Translational landslides are subdivided into block slide landslides, block slide landslides, and translational landslides (slab slide). Flat landslides are classified in simple terms based also on the material involved, which is why the main types are rock slides, debris slide, and mudslides.
7.3. Flows
The flows (Figure 5) are spatially continuous movements, in which the shear surfaces are very close, of short duration, and, therefore, difficult to observe. The movement of the flows is very similar to that of a viscous fluid, reason for which the velocity distribution is not homogeneous and originates the formation of lobes from the predominance of intergranular movement. Flows involve all types of materials available and are classified based on their content, therefore they are divided into rock flows, debris flows, and soil or sand flows.

Figure 5. Landslide classification after Cruden and Varnes, 1996 (Taken from the web page of British Geological Survey).
7.4. Topless
A topless (Figure 5) consists of the rotation of a ground, rubble, or rocks around an axis or pivot determined by its center of gravity. Its movement is forward or outward, so it implies inclination. They frequently occur on one or more surfaces, in materials that have a preferential system of discontinuities such as joints, tension cracks, or columnar surfaces that are classified as overturning or spillage of rocks, debris, and soils.
These movements (Figure 5) are the result of the fracturing and expansion of compact rock soils or levels, due to liquefaction or fluidization of the underlying material, occur when thick materials, such as rock fragments, gravel, etc., are embedded in a finer material matrix or contain clays. The shear surface is not well defined, the mass involved moves fast and its transfer can take several minutes. This type of movement occurs mainly in a shallow lake and lake environments, which are located at the source of ancient ice caps on the coasts of Norway, Alaska, and Canada. Flows can be triggered by rotational movements or by seismic effects. They are classified into lateral expansions in rocks (rock spreading), in debris (debris spread), and in soils (soil spreading).
7.5. Complex movements
Complex movements occur when the initial type of movement is transformed into another as it moves down the slope, among the most important of which are avalanches or avalanches of rocks and sliding flows. Avalanches or avalanches of rocks consist of the mobilization at great distances of large masses of rocks and debris, which travel at high speed.
Sliding flows are the result of the sudden and large-scale collapse of a mass of granular material or debris traveling at fast or extremely fast speeds, because of a disturbing effect. The material involved is metastable, with a loose structure and high porosity. During the collapse, the ground load is transferred to the pore fluids (generally water), which causes an increase in the pressure of the latter and, therefore, the loss of resistance, causing the sliding flow (Hutchinson, 1988). In general, the resulting morphology is long and narrow, and the deposit area is relatively low in thickness.
7.6. Fundamental causes of movement.
Mass removal processes or ground movements occur due to two fundamental causes, which are external and internal (Terzaghi, 1950; Selby, 1993). External causes are all those that cause an increase in tension or stresses, but not in the resistance of the materials, while internal causes are those that decrease the resistance of the materials without changing the tension or stresses. In this way, it can be said that mass removal processes are those movements of soil, debris, and rock masses that occur on a slope as a result of the direct influence of gravity, and that can be triggered by internal or external factors or in simpler terms, that these processes occur when a portion of the slope becomes too weak to support its weight.
Among the most important external changes are the geometric or weight changes suffered by the slopes (as a result of erosion, undermining, incision of a river, artificial excavations, loads and discharges), the natural and artificial transient stresses at which They are exposed (earthquakes, vibrations due to explosions or the use of heavy machinery) and the changes in the hydrological regime (intensity and duration of rainfall, etc.). The main changes of internal type are related to the transformation of materials through.
Within the study area, two rock movement processes (landslide) were recognized: Rockfalls and debris flow which are described in the results (Figures 6-7).

Figure 6. Satellite image showing some examples of the susceptible area of faults, fractures, and rockfall zones of the urban settlement Marquez de Leon (Image from Google Earth Pro, 2015).

Figure 7. Map showing the zoning of the landslide (rockfall and debris flow) in the study area.
3.-METHODOLOGY
The present study represents the first stage of a larger-scale project, which comprises several stages divided into different areas of the city of La Paz, to understand the geological-urban integral knowledge. The methodology used was based on the risk zoning Analytical Hierarchy Process (AHP) and was complemented with characterization methods, due to the geological, mechanical and hydrological characteristics of the study area (Figure 8).

Figure 8. Methodology applied to the study area.
Due to the lack of inventory of landslides and/or rockfalls events in the study area, it was determined to carry out one as a starting point (Figure 7), and then complementary methods were applied, both direct qualitative methods and indirect quantitative methods. through fieldwork and the recognition of aspects of lithology, geomorphology, structural geology (faults, fractures, and joints), framed in regional tectonics. The zoning of the risk consists of the delimitation and characterization of space and/or area of the physical environment according to certain properties and constitutes one of the pillars of urban planning. The complexity of these interrelationships makes it difficult to estimate threats in an integrated manner and it is considered that the vision of threats independently is more in line with the sustainability scheme that is intended to be given to the planning of the territory and particularly to the zoning of the risk. Thus, adequate zoning of the risk must contemplate the study of the specific risks that, due to the action of each of the identified natural hazards, occur in an area. From this procedure and with the support of several tools and guide classifications (Rose, 2005., Bergren, 1992., Soeters and Van Westen, 1996) it is possible to characterize risk situations (including their dimensions).
The Analytic Hierarchy Process (AHP) method used in this paper is a mathematical method created to evaluate alternatives when several criteria are considered and are based on the principle that the experience and knowledge of the actors are as important as the data used in the process. The AHP development by Saaty (1980, Saaty, 1990, 1994; Saaty and Vargas, 2001; Rahaman and Aruchamy, 2014), which consists of matrix analysis and involves value judgments. In this way, the matrix of preference over the selected criteria was generated, obtaining the weighting of the eight chosen variables. It was important the knowledge of the study area, the documentation, and local studies generated to date, where the criteria of the specialists are taken up. The estimation and numerical assignment of slip factors.
The determination of the numerical allocation of the landslide risk assessment factor is a numerical system that depends on the relevant factors. By superimposing the elements or parameters that indicate geological and hydrological hazards, a zoning map of susceptibility can be developed, as well as delimiting the possible risk areas, granting each factor a specific weight and value, and analyzing the study site, with the help of the various thematic maps.
The AHP uses comparisons between pairs of elements, building matrices from these comparisons, and using elements of matrix algebra to establish priorities among the elements of a level, concerning an element of the immediately higher level. The pairwise matrix has been formed with the help of Saaty’s (1980) fundamental scale (Figure 9).

Figure 9. Table of values assigned to the conditioning factors for areas susceptible to geo-hazards.
In the study area, specific factors of the physical environment were identified and numerical values were assigned to the factors according to the degree of influence. The different classes within each causal factor were also assigned values according to their influence, to give a more precise assignment of each causal factor and their respective subclasses.
Relevant factors for the zoning mapping of susceptibility to landslide risks include: lithology, slope, elevation, use and land cover, urban road density, line density, drainage density and precipitation (Table 2) The maximum numerical estimate of the sliding risk evolution factor for different categories is determined based on their estimated importance to cause instability. The important factors responsible for the geo-hazards (landslide & floods) area were assigned numerical values (range) on a scale of 1 to 5 in order of importance.
This part of the methodology is the basis for giving weight (wi) to each parameter and defining its relative importance to induce landslides (Ri). These weighted factor maps were superimposed using a multivariate criteria analysis to prepare a risk susceptibility map (RSM) for the present study area.
1. Risk vulnerability mapping.
The risk vulnerability map is based on geo-hazard zoning that was prepared by calculating the slip potential index and classifying the potential index as low, medium, high, and very high.
The slip potential index is defined
(SPI) = Σn i = 1 (wi * Ri) (1)
Where wi denotes the weight for the factor i and Ri denotes the classification of the class of factor i. In this study, the total number of factors (n) is 8, where the class classification varies from 1 to 5.
The landslide model was created and the weighting and classification are assigned to each category. Depending on the issues and their impacts, different areas were delineated. The total estimated zoning of landslide risk (ZLR) was calculated as follows:
Value ZLR = L + SL+ ELE + SL/U-SL + DD+ URD + SFD + RF
Where,
Value of ZLR = Sum of ratings of all the causative factors,
ZLR = Lithology + Slope+ Elevation + Use/ soil cover + Drainage density + Urban Road Density + Structural Density + Rainfall.

Table 2. Table of values assigned to the conditioning factors for areas susceptible to geo-hazards.
The different thematic layers were reclassified using the Jenks method, which is based on Jenks’ natural break algorithm, thereby minimizing the internal variability of the classes and maximizing the differences between classes. Besides, the Latent Semantic Indexing (ISL- Latent Semantic Indexing) was used to prepare the risk susceptibility map (RSM), whereby all the layers of the map were superimposed and validated using the landslide incidence points collected during fieldwork.
Based on this methodology and through the use of the ArcGIS software, several thematic maps based on and related to the digital elevation model (DEM) were generated: General geological map, Lithology, Slope, Elevation, Soil/Use cover + Drainage Density, Urban Road Density, Structural Density, Rainfall (Table 2) and as a final product, a susceptibility map. On the other hand, indirect-qualitative methods consisted of the use of satellite images, aerial photography scale 1:50,000, tools of the Geographic Information System (GIS), which helped to detect, classify and zoning areas with potential geological and hydrogeological risks represented in relevant thematic layers belonging to the causal factors (Geomorphology, lithology, topography, stratigraphy, faults, fractures, drainage, precipitation, etc.), with this several thematic maps were produced.
4.-LANDSLIDE SUSCEPTIBILITY ANALYSIS
4.1. Landslide inventory.
It is very important to determine the location and area of the landslide correctly when preparing landslide susceptibility maps. The landslide inventory is an essential part and basic information for any landslide zoning, such as zones of susceptibility, risk, and danger. It involves the location, classification, volume, travel distance, activity status, and date of occurrence of the landslide in an area (Fell et al. 2008a). There was no inventory for the study area since previous studies on the subject of colony-scale geo-risk susceptibility had not been carried out (Figure ).
The inventory of landslides was determined from field records and visual interpretation of aerial photographs and satellite images. In this study, field registration resulted in nine landslides (fall rocks, debris flow). Most of the landslides identified in this region have occurred in areas close to the Marquez de Leon urban settlement, with the severity and high rainfall in hurricane seasons as the triggering factor.
4.2. Elevation
The area has a low relative relief that refers to the difference between the highest altitude (306m) and the lowest in an area (100m), distributed in a narrow form in its southern portion and to the north it expands until reaching the Gulf of California, forming the Valley of La Paz and delimited by the La Paz fault.
The highest values indicate in the relief the presence of faults and fractures of a local nature, and that is a consequence of the regional faulting, denoting a mature topography.
These conditions influence risk susceptibility agents to play a vital role in the vulnerability of urban settlements, the transport network, and the land. The study area is delimited by two high-flow streams in hurricane season where the relief plays a factor that influences its volume and speed of currents. All this consequently increases the risk of flooding.
There is a relatively medium variation in the relative relief (Figure 10) that ranges from low altitude to high altitude: The class for the relative relief factor (elevation) varies from 0.0-382 and the assigned weight (15) of relative relief were classified according to the influence on landslide susceptibility. Higher altitude above 254m was assigned a higher class of 382, a moderate altitude of 150-200m as assigned mean grade of 21.6-32.4, and low altitude below 100m was assigned a class very low (76) (Figure 10).

Figure 10. Thematic maps of the two factors involved in the landslide susceptibility analysis. A: Elevation, B: Slope Aspect.
4.3. Slope aspect
The aspect defines the direction of the downward slope of the maximum rate of change or the direction of the steepest slope in the x-y plane. The slope aspect values indicate the directions that slopes face. We can classify the aspect directions based on the angle of the slope with a descriptive direction. The aspect is important to understand the stability of the slope. In general, slopes from the northwest (NW) to southwest (SW) are relatively more susceptible to slope failure and landslide activities. The classes of aspects were classified according to the stability of the slope. The current aspect of the study area was classified into 9 classes divided into geographic quadrants, with the aspect dominating the NW-SW orientation with 55% of the area and a lower percentage (45%) appearance in NE-SE orientation (Figure 10).
4.4. Slope
The slope can be defined as the vertical slope between the top of the hill and the bottom of the valley, meets the horizontal line, and is generally expressed in degrees, Strahler (1964).
Based on which the Digital Elevation Model (DEM) has been generated. DEM as an input parameter for slope. In the study area, there are 6 categories of slope classes and they are 0–4.6°, 4.6°–11.3°, 11.3°–19.2°, 19.2°–27.2°, 27.2°–36.2°,36.2°–65.4 ° (Figure 11). The study area shows, in general, the northwest-southwest (NE-SW) slopes with 90% of the total area and representing 497,062m2 and 10% (54,784m2) behaving with a northwest-southeast slope (NW- SE), which is more susceptible to slope failure and landslide (Figure 11). The weight for the slope factor is 16. The slope classes were classified based on the stability of the slope; the highest rating was assigned to the NW-SE with a class of 32.4-43.4, followed by the northeast-southeast (10.8-21.6), the lowest rating was assigned to the plane with (Table 2).

Figure 11. Thematic maps of the two factors involved in the landslide susceptibility analysis. C: Slope, D: Density of structures.
4.5. Density of structures.
The density of structures (faults and fractures) and their density in lithological outcrops are two factors that are often used for GIS-based landslide vulnerability analysis (Figure 11). Several studies have found that guidelines directly influence the occurrence of landslides (Atkinson and Massari 1998; Pachauri et al., 1998; Suzen and Doyuran 2004; Lee, 2007). In this study, the Geological Resistance Index (GSI), introduced by Hoek (1994), Hoek et al., (1995) and Hoek and Brown (1998) that provide a system to estimate the reduction in resistance of rock mass for different geological conditions identified by field observations, based on the visual impression of the rock structure, in terms of blockage and surface condition of discontinuities indicated by roughness and joint alteration (Table 1; from Hoek and Brown 1998).
In the study area, 4 RGI values were detected and classified (Figure 4-5), and two faults of normal components and one inferred fault (NE strike / SW Dip) that crossed the urban settlement, Marquez de Leon, with a buffer zone. The density of the lineaments was 25 m. Therefore, the weight given to this factor was 8 with the subdivision of five classes with values from the highest of 25 (Index 40) that corresponds to the normal and inferred faulting detected in the study area and lower (6 to 9 representing the fracturing).
4.6. Use/soil cover.
In general, land use/soil cover affects the resistance of the slope materials against slippage and the control of the water content of the slope. It reflects the relationships between land use, risk, and susceptibility to natural disasters. The study area is characterized by its use in urban development in 90% and the rest is used as a commercial area, being of characteristics of a plain cut by streams, only a portion (NW part) of the total area (547,847 m2) has endemic vegetation of semi-desert type (Land grass-Cactaceae) (Figure 12). The weight for land use is 14 and the land use classes were classified according to the influence of vulnerability to landslides, the highest index (42) was assigned for urban housing use and vegetation endemic (14) (Table 2).

Figure 12. Thematic maps of the two factors involved in the landslide susceptibility analysis. E: Use/soil cover, F: Drainage density.
4.7. Drainage density.
The general drainage pattern is a dendritic to subdendritic pattern, which is represented in the study area by two streams of intermittent flow due to the climatic regime of the region. A mathematical expression of the drainage morphometry of an area is the drainage density, which is a measure of the length of the stream channel per unit area of the drainage basin [Drain density (Dd) = Length of stream (L) / Basin area (A)]. Drainage density measurement is useful in determining landscape dissection and runoff potential. Higher values denote a greater degree of earth dissection, as well as indicate the greater probability of slope failure. The drainage density in the study area can be classified as very low density (0.8 km2) to very high density in times of hurricanes (4 km2). In the study area, approximately 95% of the area belongs to the low-density categories. Followed by a medium-density area (5%) (Figure 12). The weight of the drainage density is 12 and the drainage density classes were classified according to landslide vulnerability. Very high density is more vulnerable in this area, so the upper class 238.9-298 is assigned values for the medium classes of 59.7-179.2, and low density for the assigned class of 0.0-59.7 (Table 2)
4.8. Precipitation.
Rainfall as a risk factor is important for the region and study area since the hydrometeorological conditions produce a large number of hurricanes and storms. All this produces a high susceptibility to flash floods and consequently, this can be a trigger for landslides, fallen rocks, and / or debris flows. Therefore, the rainfall has been considered as one of the main parameters in the production of landslide maps. Water infiltrates rapidly with heavy rains and increases the degree of saturation and the potential for landslides to occur (Pourghasemi et al., 2009). In general, the study area is formed by a valley surrounded by hills of medium altitude (300m) and with a semi-desert climate. In the present study, 5 climatological stations were taken (El Cajoncito, Aeropuerto Viejo, La Paz-DGE, La Paz-OBS, and Lagunillas) near the Marquez de Leon urban settlement to study the rainfall (Figure 13) The rainfall factor was determined in classes> 100 to <100mm / year that gave an index of 10 and 15 respectively (table …). Rain on its thematic map was classified into 10 categories, which are subdivided into ranges from 0 mm/year to 4000 mm/year. The category assigned to the study area was given at 125-400mm/year.
4.9. Distance to the road.
Distance to the road is one of the important parameters in the preparation of landslide vulnerability maps. The distance to the road parameter reflects human activities (Pourghasemi et al., 2009). In other words, landslides can occur on road-intersecting slopes (Nielsen et al, 1979). According to recent studies, cutting highway slopes construction vibrations and frequency caused by automobiles induce landslides (Mittal et al., 2008, Yalcin 2008). Roads change the nature of the topography, decrease the cut resistance of the toe of the slope, and cause tensile stress. In the present study, the main urban roads are observed and this factor was divided into 5 classes with weights from 0 to 28, giving it a weight of 10 (Figure 13). The range distance from 0 to 25 m for each urban road divided into 5 ranges of 5m each (Figure13), so the distances from the class to the road are classified according to vulnerability. The shorter distance from the main road is more prone to landslides, which is awarded for a higher rating of 20-25m (index 40-50), followed by an intermediate of 15-20m (index 30-40) and the lowest weighting of the index (0-30) it occurred at 0-20 m.

Figure 13. Thematic maps of the two factors involved in the landslide susceptibility analysis. G: Precipitation, H: Distance to the road.
5. RESULTS
The urban geology of the study area is characterized by an isolated sequence of rock outcrops in its NNE portion, which are mainly made up of volcanic and vulcanosedimentary rocks. This lithology is grouped into the recognized Comondú Formation within the area in which its geomechanical condition and its anthropic action stand out. The lithological conditions and their characterization are related to other factors (hydrogeological, hydrometeorological, and
geomechanical) that generate mass elimination movements and rock blocks.
The sliding processes (rockfalls and debris flow) are represented with 80% of the events only by a single lithology: riodacite. The distribution of these events was located within the slopes found in the upper and middle parts of the topography (slopes from 25° to 28°). Based on the above conditions, falling processes and / or rock flows were recognized 621 they occur in two ways:
- Events that occur in the rock (materials of greater competition) that correspond to blocks of riodacitic composition that are on a topographic slope of 25° and vary in dimensions from 2 to 4 m in length, which approximate by a weight of 3 tons each.
- A massive bundle of volcanic clasts (debris flow) that are classified as less competent materials. In particular, this category includes inconsistent material, corresponding to volcanic lithology (unsold pyroclastic deposits).
These events are simple blockages and/or translational landslides, which have a great influence on the factors of structural geology, erosion, and gravity as sliding mechanisms. Of these two sets, only 9 landslides in individual rock blocks and 1 debris flow (high temperature volcanic clastic deposits), without soil identification in these processes in the area. Both occur in events mainly in downward movements, such as simple translation and block sliding that end as slow-motion flows according to the classification of Dikau et al., (1996). Being the failure mechanism and the separation mode controlled by geological and geotechnical factors.
The volumes of rock material removed in each removal process vary from the order of meters to hundreds of cubic meters and the displacements of individual blocks (rockfalls) reach up to 3 to tons of weight (Figure 6).
Furthermore, this area is limited by the current that crosses the northern part of the Marquez de Leon urban settlement and, in turn, coincides with some urban settlements, since they are established on the very close margins of hills and streams. This condition of geohydrology and hydrometeorology denotes poor urban planning and a high risk for its population when it is installed in flood zones.
The geomechanical behavior of lithology is based on observations at the level of outcrops, where the structure of lithology can be seen, formed by well-defined rock segments in two or three directions (fractures), caused by normal failure and fractures in the arrangement of joints.
The results obtained based on the geotechnical characterization (Geological resistance index (GSI)) turns out to be very homogeneous and close in parameters, since it is a volcanic and vulcanosedimentary lithology with a similar genesis in processes and time of evolution.
The discontinuity conditions are very good to good (range 70 to 80) since the surfaces are weather resistant (Table 1).
The results of this work will allow in the long term to make susceptibility maps to geological risks centered on the scale of the city of La Paz, which in turn can be projected to other urban areas of the State of Baja California Sur. All this aims to form a geotechnical-based tool to achieve a sustainable vision of our environment and physical environment that leads to a future sustainable urban development in the state of Baja California Sur., Mexico.
Finally, it is considered that this type of zoning of areas susceptible to risks (urban settlement scale) has been carried out in an almost globally low percentage, considering the scale used for the present study (1: 6,500), which provides an analysis of the risk conditions where the citizen of any city can be located in his community and know his conditions of civil protection. Unlike most risk studies that offer results on very large scales and only offer low-resolution insight into this problem (Figure 14).

Figure 14. – Geo-hazard susceptibility map of the Manuel Marquez de Leon urban settlement, La Paz., BCS, Mexico.

Figure 15.-Distribution of areas and percentages that represent the susceptibility of geohazards in the study area.
From the analysis (Figure 15), it is evident that 33.38% of the total area of the area dominates with a very low risk of susceptibility, followed by the zones of medium susceptibility (19.97%), and this trend of very high risk only represents the 6.68%.
Table 3. Table of susceptibility distribution in the study area.

6.-DISCUSSION
Today, natural disaster risk analysis is unimaginable without the digital backing and support of geographic information systems (GIS). Natural disasters are multidimensional phenomena with a spatial dimension, which makes GIS highly applicable for such analysis. Landslides, defined as the massive movement of rocks, debris, or earth down a slope (Cruden, 1991), can be triggered by various external factors (Wang et al., 2013). These include heavy rains, earthquakes, changes in water level, storm waves, or rapid erosion of the current that cause a rapid increase in shear stress or a decrease in shear strength of materials that form slopes. As one of the main natural hazards, landslides claim people’s lives almost every year and cause enormous damage to urban property (Hansen, 1984; Chung and Fabbri, 1995).
Most disaster-prone cities are not prepared for future disasters and are not equipped enough to reduce the risks associated with them. When planning an urban environment, only economic and social parameters are generally taken into account. As a result, urban areas are susceptible to natural disasters, which cause extensive damage to them, because cities or towns have been repeatedly located in vulnerable areas (Bathrellos et al., 2012) For example, in 2030, the United Nations Development Program (UNDP) envisages it that:
- At least 61% of the world population will live in cities and more than 2 billion people in the world will live in slums.
- In Asia, some 120,000 people join the urban population every day, which means the construction of more than 20,000new homes, 250 kilometers of new roads, and additional infrastructure to supply more than six million liters of drinking water.
- UNDP insists that nationwide risk reduction must also incorporate a robust risk reduction component in urban areas.
Recent urban risk reduction projects developed by UNDP in collaboration with partner governments range from the national level, with comprehensive DRR programs (including DRR components for urban areas) to local DRR programs at the municipal level, such as in Amman and Aqaba (Jordan), Quito (Ecuador), Gorgan and Kerman (Iran), in Damascus (Syria) or many cities in India and Pakistan. Also, to support at the national level, UNDP offers technical advice for the development of regional knowledge networks and fosters partnerships to address the risks of large urban areas in Africa and Latin America.
Reducing the environmental impact of the home and increasing its resilience are basic measures to consider. In Mexico, it’s estimated that more than 87.7 million people live in areas at high risk of natural and climatic disasters. The disasters related to these events between 2000 and 2016, including the 2017 earthquakes, caused substantial damage to more than 1.4 million housing units. Disasters related to climate change caused 82.6% of these damages, while natural disasters represented 17.4%. In total, the damages were valued at USD 20.6 billion (MXN 380.6 billion).
Local action is the linchpin of UNDP’s approach to building cities with resilience to disasters UNDP promotes the adoption of legal and legislative instruments and technical tools that prioritize Disaster Risk Reduction (DRR) as an integral part of the urban development process. Although seismic risks are paramount in many urban settings, UNDP 700 promotes a comprehensive multi-threat approach that is based on risk identification and vulnerability assessment.
Municipal administrations cannot effectively manage disasters if they lack institutional knowledge about the potential effects of threats that plague the local population, infrastructure, and economy. Disaster risk assessment is the first step before undertaking the design and implementation of prevention or mitigation measures.
The methodology (AHP) of this research work to determine susceptibility is an adaptation of the matrix method to a GIS, and it has been tested and validated in different areas of the world and the result was the generation of vulnerability (susceptibility) maps in geological risks that for the first time focus on different geological problems of the urban and suburban area of La Paz, Mexico. All of this can be used as a basis for the future sustainable urban development of the city of La Paz. These areas include urban development zones where streams and stream flooding areas are currently found, as well as hill slopes, with processes susceptible to landslides in two usual types (rockfalls and debris flows).
The location and description of the phenomena were carried out in two groups: the one that occurred in the rock (materials with greater competition) and the one that occurred in rocks with less competition. In particular, this category includes incoherent material of volcanic origin (unsoldered pyroclastic deposits) and extended material, including immature soils. Of these two sets, 9 landslides (rock falls) and 1 debris flow (volcanic deposits or severely weathered rocks) were identified. The rock movements found in the area correspond mainly to the classification of Dikau et al., (1996) and Cruden and Varnes (1996) of fall processes, simple transition landslides.
On the other hand, those that occur in materials of the soil type correspond to events that begin as translational or rotational slides that end as flows. The volumes of rock material removed in each removal process range from meters to hundreds of cubic meters. In most cases, the events were located within the concave parts of the slopes at high to intermediate topographic levels.
The movements were generated from the combination of geological factors (slope, lithology and geological structure), hydrogeological (drainage density), and geotechnical (mechanical behavior of rocks and soils). The failure mechanism and detachment mode were controlled by geological and geotechnical factors.
This aspect of the results coincides with the research carried out by Momeni et al., 2015, and Ahmed, 2015, stating that in landslides and falling rocks, the slope and appearance play an elementary role in the material flow, since the slope provides speed and the appearance indicates the direction of that slope. The proposed methodology also stands out, the possibility of evaluating the susceptibility conditions at the State and regional scale, complementing this work with statistical methods, as other authors have done (Varnes et al., 1984., Chacon et al., 2007).
These phenomena coincide in the location of urban settlements of this type that are established at the foot of the existing topography. Therefore, it is considered convenient to carry out more in-depth studies on the aspects generated by these landslide processes.
For this reason, the next objective in the study area is the location of threats and prediction, through real-time monitoring and critical thresholds of precipitation as mentioned by Hervas et al., 2003, essential tools for implementation of early warning systems. Mapping the susceptibility and the danger of landslides is very necessary nowadays due to the strong impact of these processes on people and their property. Susceptibility maps are very useful, but hazard maps are a significant improvement because they can solve the problem less conservatively and more reliably. However, the main obstacle to this landslide mapping is dating or at least determining its activity in a given period (return period). Some studies propose a methodology to determine the susceptibility in different periods of return of inventories of landslides with certain activities in these periods. Based on stereoscopic and monoscopic analysis of aerial photographs of different dates, geomorphic criteria and the study of rain time series (Fernandez et al., 2015).
7.- CONCLUSIONS
This contribution to the investigation of the current susceptibility of geo-dangers presented a methodological model (AHP methodology) for the evaluation, zoning of the susceptibility of geographic risks according to the characteristics of the study area.
It also highlights the possibility of continuing to use this methodology, to evaluate susceptibility conditions at the state and regional level, complementing this work with statistical methods and the generation of an inventory of landslides (massive and fallen movements), which will allow comparing their results and coherence in the distribution of the occurrence of all present and future landslides.
The methodological proposal also complements the results obtained with a new landslide inventory (rockfalls-debris flow), a landslide susceptibility map, which did not exist to date and which allows defining urban areas of urban development sensitive to urban settlement scale.
The conclusions of this research work are presented below:
- The conditions of the physical environment, which were used to weigh the most influential factors for the landslide susceptibility (debris flow and rockfalls), can be inferred that lithology, slope, geomorphology, IGR Index (elevation) are the most dominant factors.
- According to the analysis of the most influential factors for landslide activity (judging by their associated weights) are lithology (20), geomorphology (16), slope (15), land cover/use (14), drainage density (12) and The three factors that least 757 influence are urban density roads (10), the density of structural features (8) and rainfall (precipitation) (5).
- In terms of criticality and based on the validation of the susceptibility maps obtained, 20% of the total area has high to very high geographic risk susceptibility conditions.
- The percentage of very low to medium susceptible areas is close to the maximum 80% (79.97%).
- The proximity of urban areas to these landslide-prone and tumbled-rock areas is very close, as they are established on the margins very close to hills and streams. This susceptibility to geo-dangers, as well as the geohydrological and hydrometeorological conditions where the urban development of the different urban colonies is located, denotes little urban planning.
- The results represent the first stage of a large-scale project that began in 2018, which aims to zoning the geological and geo-hydrological risks of the entire State of Baja California Sur., Mexico and contribute new geotechnical knowledge to be used in construction regulations, as well as planning and sustainable urban development.
The author thanks to the Technological Institute of La Paz for the logistical support provided.
8.-REFERENCES
[1] Adab H, Kasturi DK, and Karim S (2013) Modeling forest fire risk in the northeast of Iran using remote sensing and GIS techniques Natural Hazards 65 (3):1723-1743. https//doi: 10.1007/s11069-012-0450-8.
[2] Ahmed, B (2015) Landslide susceptibility mapping using multi-criteria evaluation techniques in Chittagong Metropolitan Area, Bangladesh. Landslides 12, 1077–1095.
[3] Althuwaynee OF, Pradhan B, Park HJ, Lee JH (2014) A novel ensemble bivariate statistical evidential belief function with knowledge-based analytical hierarchy process and multivariate statistical logistic regression for landslide susceptibility mapping. Catena. 114:21–36.
[4] Alcántara–Ayala, I (2000) Landslides: ¿Deslizamientos o movimientos del terreno? Definición, clasificaciones y terminología, Investigaciones Geográficas, Boletín, núm. 41, Instituto de Geografía, UNAM, México, pp. 7– 25.
[5] Aleotti P and Chowdhury, R (1999): Landslide hazard assessment: summary review and new perspectives. Bull Engineering Geology and Environment 58, 21–44.
[6] Aranda-Gómez, J.J., y Pérez-Venzor, JA (1989a) Estratigrafía del Complejo Cristalino de la región de Todos Santos, Estado de Baja California Sur. Universidad Nacional Autónoma de México, Instituto de Geología, Revista, v. 8, p. 149-170.
[7] Aranda-Gómez, JJ y Pérez-Venzor, JA (1989b) La Evolución geológica del Complejo Cristalino Mesozoico a lo largo de la zona de falla de La Paz, Baja California Sur. Tercer simposium sobre Geología Regional de México. Organizado por Universidad Nacional Autónoma de México, Instituto de Geología, del 29 al 30 de mayo, resumen en memorias, p.11.
[8] Atkinson PM, Massari R (1998) Generalized linear modeling of susceptibility to landsliding in the Central Apennines, Italy.Comput Geosci 24:373–385.
[9] Bathrellos, GD, Skilodimou, HD, Chousianitis, K, Youssef, AM, Pradhan, B (2017) Suitability estimation for urban development using multi-hazard assessment map. Sci Total Environ, 575: 119 – 134.
[10] Bathrellos GD, Gaki-Papanastassiou, K, Skilodimou, HD Papanastassiou, D Chousianitis, KG (2012) Potential suitability for urban planning and industry development by using natural hazard maps and geological-geomorphological parameters. Environ. Earth, 66, 537–548.
[11] Bergren B, Fallsvik J, Viberg L (1992) Mapping and evaluation of landslide risk in Sweden Proceedings of the Sixth International Symposium on Landslides, Christchurch, pp. 873-878.
[12] Brunsden, D (1979) “Mass movements”, en Embleton, C. E. y J. B. Thornes (eds.), Progress in Geomorphology, Arnold. pp. 130.186.
[13] Carpignano A, Golia E, Di Mauro C, Bouchon S, Nordvik, JP (2009) A methodological approach for the 286 definitions of multi-risk maps at regional level: first application. Journal of Risk Research 12(3-4): 287 513–534.
[14] Chacón J, Irigaray C, Fernández T, El Hamdouni R (2007) Engineering geology maps: landslides and geographical information systems (GIS). Bull. Eng. Geol. Environ.65, 341–411.
[15] Chen W, Pourghasemi, H.R Panahi, M, Kornejad A, Wang J, Xie X, Cao, S (2017) Spatial prediction of landslide susceptibility using an adaptive neuro-fuzzy inference system combined with frequency ratio, generalized additive model, and support vector machine techniques. Geomorphology, 297, 69–85.
[16] Chung CF, Fabbri, AG, Van Westen, CJ (1995) Multivariate regression analysis for landslide hazard zonation, In A. Carrara and F. Guzzetti (Eds), Geographic Information Systems in Assessing Natural Hazards, Kluwer, Dordrecht, pp. 107–133.
[17] Coast N, Water R., Control Q, Rosa S, Weppner E, Associates, PW and Geoscience, H (2008) Slope stability modeling and landslide hazard in freshwater creek and Ryan slough Humboldt County, California, Humboldt County, 2008.
[18] Coates. DR (1977) Landslide perspectives, in Coates, D R. (ed.), Landslides, Geological Society of America.
[19] Cruden, DM (1991) A simple definition of a landslide. Bulletin International Association of Engineering Geology 43, 27–29.
[20] Cruden DM, Varnes DJ (1996) Landslide types and processes. In: Turner A. K.; Shuster R. L. (eds) Landslides:
[21] Investigation and Mitigation Transp Res Board, 1996, Spec. Rep. 247, pp 36–75.
[22] Crutcher HL, and Quayle, RG (1974) Mariner’s worldwide climatic guide to tropical storms at sea: Naval Weather Service Environmental Detachment, Asheville, NC, 426 pp.
[23] Crozier, MJ (1973) Techniques for the morphometric analysis of landslips”, Zeitschrifl fur Geomorphologie, 17,pp. 78-101.
[24] Cruz-Falcón, A. Vázquez-González, R, Ramírez-Hernández, J, Nava-Sánchez, EH, Troyo-Diéguez, E, Rivera- Rosas, JJ, Vega-Mayagoitia, JE (2011) Precipitación y recarga en la cuenca de La Paz, B.C.S. Universidad y Ciencia, 27 (3), pp. 251-263.
[25] Dhar, S, AK Rai, and P Nayak. (2017) Estimation of seismic hazard in Odisha by remote sensing and GIStechniques. Natural Hazards 86 (2):695-709.
[26] Dikau R, Brunsden D, Schrott, L. & M.-L, Ibsen (Eds.) (1996) Landslide Recognition. Identification, Movement,and Causes. Wiley & Sons, Chichester.
[27] EPOCH (European Community Programme) (1993). Temporal occurrence and forecasting of landslides in the European Community, Flageollet, J. C. (ed.), 3 volumes, Contract no 90 0025.
[28] Fell R, Corominas J, Bonnard Ch, Cascini L, Leroi E, Savage WZ (on behalf of the JTC-1 Joint Technical Committee on Landslides and Engineered Slopes) (2008a) Guidelines for landslide susceptibility, hazard and risk zoning for land-use planning. Eng Geol 102:85–98.
[29] Fernández T, Pérezac JL, Cardenalac FJ, López A, Gómez, JM, Colomo, C, Delgado J. and Sánchez, M (2015) Use of a light UAV and photogrammetric techniques to study the evolution of a landslide in Jaén (Southern Spain). Int. Arch. Photogramm Remote Sens. Spatial Inf. Sci., XL-3/W, 3241–3248
[30] Garcia-Aristizabal AP. Gasparini, and G. Uhinga (2015) Multi-risk Assessment as a Tool for Decision-making. 846.
[31] In Climate Change and Urban Vulnerability in Africa, A Multidisciplinary Approach. Edited by S. Pauleit, G.orgensen, Kabisch, P. Gasparini, S. Fohlmeister, I. Simonis, K. Yeshitela, A. Coly, S. Lindley, W. J. 848.
[32] Kombe, 229–258. Future Cities, Vol. 4, Springer International Publishing. DOI:10.1007/978-3-319-03982-4_7 Gill, JC, BD (2014) Malamud Reviewing and visualizing the interactions of natural hazards Rev. Geophys., 52, pp. 680-722.
[33] Greiving Stefan, Mark Fleischhauer, and Johannes Lückenkötter (2006) A methodology for an integrated risk assessment of spatially relevant hazards. Journal of Environmental Planning and Management 49 (1):1-19.
[34] Grünthal G, Thieken AH, Schwarz J, Radtke KS, Smolka A, Merz B (2006) Comparative risk assessment for the city of Cologne—storms, floods, earthquake. Nat Hazards 38(1–2):21–44
[35] Handong He, Di Hu, Qun Sun, Lei Zhu, Yanrong, Liu (2019) A Landslide Susceptibility Assessment Method Based on GIS Technology and an AHP-Weighted Information Content Method: A Case Study of Southern Anhui, China.
[36] Hansen A, Franks, CAM, Kirk, PA, Brimicombe, AJ, and Tung, F (1995) Application of GIS to hazard assessment, with particular reference to landslides in Hong Kong. In Carrara, A., and Guzzetti, F., editors, Geographical Information Systems in assessing natural hazards, Dordrecht: Kluwer, 135–75
[37] Hausback BP (1983) An extensive volatile-charged rhyodacite flow, Baja California, Mexico: Geol. Soc.America, Abstr. with v. 15, p. 281 (abstract).
[38] Hervas J, Barredo J, Rosin P, Pasuto A, Mantovani F, & Silvano S (2003) ‘Monitoring landslides from optical remotely sensed imagery: the case history of Tessina landslide, Italy’, Geomorphology 54, 63–75.
[39] Hinkel Jochen, (2011) Indicators of vulnerability and adaptive capacity”: towards a clarification of the science-policy interface.”Global Environmental Change 21 (1):198- 208.
[40] Hoek E, (1994) Strength of rock and rock masses, ISRM News Journal, 2 (2), 4-16.
[41] Hoek E, Kaiser PK, Bawden WF (1995) Support of underground excavations in hard rock. Rotterdam,Netherlands: Balkema.
[42] Hoek E, Marinos, P and Benissi, M (1998) Applicability of the Geological Strength Index (GSI) classification for very weak and sheared rock masses. The case of the Athens Schist Formation. Bull. Engg. Geol. Env. 57(2), 151-160.
[43] Hoque MAl-A, Stuart Phinn, Chris Roelfsema, and Iraphne Childs (2018) Assessing tropical cyclone risks using geospatial techniques.” Applied Geography 98:22-33.
[44] Hutchinson JN (1968) Mass Movement. In Encyclopedia of Geomorphology (R.W. Fairbridge, ed.), Reinhold, New York, pp. 688-695.
[45] Hutchinson JN (1988) General report morphological and geotechnical parameters 1f landslides in relation to Geology and Hydrogeologic, in Bonnard, C. (Ed.). Proceedings of the Fifth lnternational Symposium on Landslides, A. A,Balkema, Rotterdam, Netherlands, vol. I, pp. 3-35.
[46] Kabenge M, Elaru J, Wang H, Li, F (2017) Characterizing flood hazard risk in data-scarce areas, using a remote sensing and GIS-based flood hazard index. Nat Hazards. 89(3):1369–1387.
[47] Kappes MS, Margreth Keller, Kirsten v E, and Thomas, G (2012) Challenges of analyzing multi-hazard risk: a review. Natural Hazards 64 (2):1925- 1958.
[48] Kazakis N, Kougias I, Katsivalis, T (2015) Assessment of flood hazard areas at a regional scale using an index- 886 based approach and Analytical Hierarchy Process: application in Rhodope–Evros region, Greece. Sci Total 887 Environ. 538:555–563.
[49] Ladd, GE (1935) Landslides, subsidences, and rockfalls. Bulletin of the American Railway Engineering Association, 37, pp. 1091-1 162.
[50] Lee S, Pradhan, B (2007) Landslide hazard mapping at Selangor, Malaysia using frequency ratio and logistic regression models. Landslides 4:33–41.
[51] Lehner, B, Petra, D Joseph, A, Thomas H, and Frank, K (2006) Estimating the impact of global change on flood and drought risks in Europe: a continental, integrated analysis.” Climatic Change 75 (3):273-299.
[52] Baoyin Liu, Siu LS, and Gordon, M (2016) Hazard interaction analysis for multi-hazard risk assessment: a systematic classification based on hazard-forming environment, Nat. Hazards Earth Syst. Sci., 16, 629–642, DOI:10.5194/nhess-16-629-2016, 2016.
[53] López-Álvarez, LA (2002) Diagnostico de riesgos urbanos en el área metropolitana de Tijuana..H. Ayuntamiento de Tijuana Baja California. Dirección Municipal de Protección Civil. Tijuana Baja California. México, 103 pp.
[54] Luzi L, and Pergalani F (1996) Applications of statistical and GIS techniques to slope instability zonation (1:50.000 Fabriano geological map sheet). Soil Dynamics and Earthquake Engineering 15, 83–94.
[55] Marinos P, Hoek E (2000) GSI: a geologically friendly tool for rock mass strength estimation. In: Proceedings of 903 the GeoEng2000 at the international conference on geotechnical and geological engineering, Melbourne, Technomic Publishers, Lancaster, pp 1422–1446.Mina-Uhink F. 1957. Bosquejo geológico del Territorio Sur de la Baja California. Bol. Assoc. Mex. Geol. Pet. 9: 188–192.
[56] Marzocchi W, Garcia-Aristizabal A, Gasparini P, Mastellone ML, Di Ruocco A (2012) Basic principles of multi-risk assessment: a case study in Italy Nat. Hazards, 62 pp. 551-573.
[57] Mittal SK, Singh M, Kapur, P, Sharma, BK, Shamshi, MA (2008) Design and development of instrument network for landslide monitoring, an issue an early warning. Journal of Scientific &Industrial research 67,361–365.
[58] Momeni E, Armaghani DJ, Hajihassani M (2015) Prediction of uniaxial compressive strength of rock samples using hybrid particle swarm optimization-based artificial neural networks. Measurement 60:50–63
[59] Monzalvo-Mireles, M (2010) Simulación hidrodinámica del acuífero de La Paz y su aprovechamiento como fuente de desalación: La Paz, Baja California Sur, México, Universidad Autónoma de México (UNAM), Tesis doctoral,225 pp.
[60] Nielsen TH, Wrigth RH, Vlasic TC, Spangle WE (1979) Relative slope stability and land-use planning in the San Francisco Bay region, California. US geological survey professional paper 944.
[61] Ortega-Gutiérrez, F (1982) Evolución magnética y metamórfica del complejo cristalino de La Paz, Baja California Sur., Soc. Geológica Mexicana, Convención Nacional, Programas y Resúmenes. México D.F, p. 90.
[62] Oropeza, O (2008) Prevención de desastres de origen hidrometeorológico, una prioridad nacional. El caso de las inundaciones. En: Rodríguez, D., S. Lucatello y M. Garza (Coordinadores). Políticas Públicas y Desastres. Instituto Mora-Red Mexicana de Estudios Interdisciplinarios para la Prevención de Desastres, A.C. México, D. F. Pp. 125-144.
[63] Pachauri AK, Pant M (1992) Landslide hazard mapping based on geological attributes. Eng Geol 32:81–100
[64] Pérez-Venzor, JA (2013) Estudio Geológico –Geoquímico del Borde Oriental del Bloque de los Cabos Baja California Sur, México: México, D.F., Universidad Nacional Autónoma de México. tesis doctoral. 297pp.
[65] Pourghasemi HR, Moradi HR, Fatemi Aghda Saidmahm, Mahdavifar, MR, Mohammadi Majid (2009) Landslide Hazard Assessment Using Fuzzy Multi-Criteria Decision- Making Method; Iranian Journal of Watershed Management Science&Engineering, 3(8): 51-62.
[66] Rahaman SA, Archway S, Jegankumar R (2014) Geospatial approach on landslide hazard zonation mapping using multicriteria decision analysis: a study on Coonoor and Ooty, part of Kallar Watershed, The Nilgiris, Tamil Nadu. ISPRS – International Archives of the Photogrammetry, Remote Sensing and Spatial Information Sciences 934 XL-8:1417–1422.
[67] Rojas-Soriano H, Alvarez-Arellano A.D (2007) Zonas de peligro por inundación y erosión en el área de Cabo San Lucas, B.C.S., México. Jornadas Internacionales sobre Gestión del Riesgo de Inundaciones y Deslizamientos de Laderas.Brasil.15 pp.
[68] Rose BT (2005) Tennessee rockfall management system. Dissertation for the degree of doctor of philosophy in Civil Engineering. Virginia Polytechnic Institute and State University. Blacksburg, Virginia. 107p.
[69] Saaty TL (1990) The analytic hierarchy process: planning, priority setting, resource allocation, 1st ed. RWS Publications, Pittsburgh, p 502 Saaty TL (1994) Fundamentals of decision making and priority theory with analytic hierarchy process, 1st ed. RWS Publications, Pittsburgh, p 527.
[70] Saaty TL (1994) How to make a decision: the analytic hierarchy process, Interfaces, Vol. 24, No. 6, pp.19–43.
[71] Saaty TL, Vargas LG (2001) Models, methods, concepts, and applications of the analytic hierarchy process,1st edition. Kluwer Academic, Boston, p 333.
[72] Sarkar S, Roy AK, and Raha, P (2016) Deterministic approach for susceptibility assessment of shallow debris slide in the Darjeeling Himalayas, India. Catena, 142, pp. 36-46. 2016. DOI: 10.1016/j.catena.02.009.
[73] Schaaf, P., Bohnel, H., and Pérez-Venzor, J.A., 2000, Pre-Miocene paleogeography of the Los Cabos Block, Baja California Sur: Geochronological and palaeomagnetic constraints: Tectonophysics, v. 318, p. 53–69.
[74] Selby MJ (1993) Hillslope materials and processes. Za. ed., Oxford University Press, Oxford.
[75] Sharma CK (1990) Geology of Nepal Himalaya and adjacent countries. Sangeeta Sharma, Kathmandu, p 479.
[76] Sharpe CFS (1938) Landslides and related phenomena, Columbia University Press, New York.
[77] Schmidt J, Matcham I, Reese S, King A, Bell R, Henderson R, Smart G, Cousins J, Smith W, Heron D (2011) Quantitative multi-risk analysis for natural hazards: a framework for multi-risk modeling. Nat Hazards 58(3):1169–1192.
[78] Soeters R, Van Westen, CJ (1996) Slope Instability Recognition, Analysis, and Zonation. In: Turner, A.K., and Schuster, R.L. (eds), Landslides, investigation, and mitigation. Transportation Research Board, National Strahler, AN (1964) Quantitative geomorphology of drainage basins and channel networks. In Chow, V.T. (Ed.): Handbook of applied hydrology. 4-39/4-76.
[79] Su¨zen ML, Doyuran V (2004a) Data-driven bivariate landslide susceptibility assessment using geographical information systems: a method and application to Asarsuyu catchment, Turkey. Eng Geol 71:303–321
[80] Terzaghi K (1950). Mechanism of Landslides. Application of Geology to Engineering Practice, Berkey, Geological Society of America, p. 83–123
[81] Theilen-Willige, B (2010) Detection of local site conditions influencing earthquake shaking and secondary effects in Southwest-Haiti using remote sensing and GIS-methods.” Natural Hazards and Earth System Sciences 10 (6):1183.
[82] Rahaman SA, and S. Aruchamy (2017) Geoinformatics based landslide vulnerable zonation mapping using the analytical hierarchy process (AHP), a study of Kallar river subwatershed, Kallar watershed, Bhavani basin, Tamil Nadu. Model Earth Systems and Environment. 3 (1): 41.
[83] Romero-Vadillo E, Romero-Vadillo, IR (2010) Plan de acción ante cambio climático del Estado de Baja California Sur: Ciclones tropicales (PEACC-BCS), Universidad Autónoma de Baja California Sur, Reporte, 23 pp.
[84] Van Westen CJ, Kappes MS, Luna BQ, Frigerio S, Glade T, and Malet JP (2014) Medium-scale multi-hazard risk assessment of gravitational processes, in Mountain risks: from prediction to management and governance, 975 van Asch, T., Corominas, J., Grieving, S., Malet, J.-P., and Sterlacchini, S., Springer, Netherlands, 201–231.
[85] Varnes, DJ (1958) Landslides types and processes”, in Eckel, E. B. (ed.), Landslides and Engineering Practice.Highway Res. Board Special Report 29, pp. 20-47.
[86] Varnes, DJ (1978) Slope movements, types and processes, Landslides: Analysis and control, transportation research board, Spec. Rep. 176, Bulletin of the 11-33, National Academy of Science, Washington.
[87] Varnes, DJ (1984) Landslide hazard zonation: a review of principles and practice. Commission on Landslides of the IAEG, UNESCO, Paris. Natural Hazards Series 3, p. 63.
[88] Vega-Granillo EL, Vega-Granillo R, De la O-Villanueva M, Araux-Sánchez E (2004) Geología Urbana de la región de Guaymas y San Carlos, Sonora. Revista GEOS, V. 24, No. 2.p-188.
[89] Wang L, Hwang JH, Luo Z, Juang CH, Xiao J (2013) Probabilistic back analysis of slope failure – a case studying Taiwan. Comput Geotech. 51:12–23 Ward WH (1945) .The stability of natural slopes, Geographical Journal. 105:170-197.
[90] Yalcin A (2008) GIS-based landslide susceptibility mapping using analytical hierarchy process and bivariate statistics in Ardesen (Turkey): Comparison of results and confirmations.” Catena 72 (1): 1–12. https://doi.org/10.1016/j.catena.2007.01.003
[91] Zaruba, Q. y V. Mencl (1969), Landslides and their control, Elsevier, Amsterdam. The Netherlands.
[92] Zhang G, Cai Y, Zheng Z, Zhen J, Liu Y, Huang K (2016) Integration of the statistical index method and the analytic hierarchy process technique for the assessment of landslide susceptibility in Huizhou, China. CATENA. 142:233–244.